


Publication bias is when academic journals make publication of a paper contingent on the results obtained. Typically, though not always, it’s assumed that means results that indicate a statistically significant correlation are publishable, and those that don’t are not (where statistically significant typically means a result that would be expected to occur by random chance less than 5% of the time). A rationale for this kind of preference is that the audience of journals is looking for new information that leads them to revise their beliefs. If the default position is that most novel hypotheses are false, then a study that fails to find evidence in favor of a novel hypothesis isn’t going to lead anyone to revise their beliefs. Readers could have skipped it without it impacting their lives, and journals would do better by highlighting other findings. (Frankel and Kasy 2021 develops this idea more fully)
But that kind of policy can generate systematic biases. In another newsletter, I looked at a number of studies that show when you give different teams of researchers the same narrow research question and the same dataset, it is quite common to get very different results. For example, in Breznau et al. (2021), 73 different teams of researchers are asked to answer the question “does immigration lower public support for social policies?” Despite each team being given the same initial dataset, the results generated by these teams spanned the whole range of possible conclusions, as indicated in the figure below: in yellow, more immigration led to less support for social policies, in blue the opposite, and in gray there was no statistically significant relationship between the two.

Seeing all the results in one figure like this tells us, more or less, that there is no consistent relationship between immigration and public support for social policies (at least in this dataset). But what if this had not been a paper reporting on the coordinated efforts of 73 research teams, committed to publishing whatever they found? What if, instead, this paper was a literature review reporting on the published research of 73 different teams that tackled this question independently? And what if these teams could only get their results published if they found the “surprising” result that more immigration leads to more public support for social policies? In that case, a review of the literature would generate a figure like the following:

In this case, the academic enterprise would be misleading you. More generally, if we want academia to develop knowledge of how the world works that can then be spun into technological and policy applications, we need it to give us an accurate picture of the world.
On the other hand, maybe it’s not that bad. Maybe researchers who find different results can get their work published, though possibly in lower-ranked journals. If that’s the case, then a thorough review of the literature could still recover the full distribution of results that we originally highlighted. That’s not so hard in the era of google scholar and sci-hub.
So what’s the evidence? How much of an issue is publication bias?
Ideal Studies
Ideally, what we would like to do is follow a large number of roughly similar research projects from inception to completion, and observe whether the probability of publication depends on the results of the research. In fact, there are several research settings where something quite close to this is possible. This is because many kinds of research require researchers to submit proposals or pre-register studies before they can begin investigation. A large literature attempts to track the subsequent history of such projects to see what happens to them.
Dwan et al. (2008) reports on the results of 8 different healthcare meta-analyses of this type, published between 1991 and 2008. The studies variously draw on the pool of proposals submitted to different institutional review boards, or drug trial registries, focusing on randomized control trials where a control group is given some kind of placebo and a treatment group some kind of treatment. The studies then perform literature searches and correspond with the authors of these studies to see if the proposals or pre-registered trials end up in the publication record.
In every case, results are more likely to be published if they are positive than if the results are negative or inconclusive. In some cases, the biases are small. One study (Dickersin 1993) of trials approved for funding by the NIH found 98% of positive trial outcomes were published, but only 85% of negative results were (i.e., positive results were 15% more likely to be published - though, as a commenter below points out, you could just as easily say null results are not published 15% of the time, and that is 7.5 times as much as positive results are not published). In other cases, they’re quite large. In Decullier (2005)’s study of protocols submitted to the French Research Ethics Committees, 69% of positive results were published, but only 28% of negative or null results were (i.e., positive results were about 2.5 times more likely to be published).
These kinds of studies are in principle possible for any kind of research project that leaves a paper trail, but they are most common in medicine (which has these institutional review boards and drug trial registries). However, Franco, Malhotra, and Simonovits (2014) are able to perform a similar exercise for 228 studies in the social sciences that relied on the NSF’s Time-sharing Experiments in the Social Sciences program. Under this program, researchers can apply to have questions added to a nationally representative survey of US adults. Typically, the questions are manipulated so that different populations receive different versions of the question (i.e., different question framing or visual stimulus), allowing the researchers to conduct survey-based experiments. This paper approaches the ideal in several ways:
The proposals are vetted for quality via a peer review process, ensuring all proposed research question clear some minimum threshold
The surveys are administered in the same way by the same firm in most cases, ensuring some degree of similarity of methodology across studies
All the studies are vetted to ensure they have sufficient statistical power to detect effects of interest
That is, in this setting, what really differentiates research projects is the results they find, rather than the methods or sample size.
Franco, Malhotra, and Simonovits start with the set of all approved proposals from 2002-2012 and then search through the literature to find all published papers or working papers based on the results of this NSF program survey. For more than 100 results, they could find no such paper, and so they emailed the authors to ask what happened and also to summarize the results of the experiment.
The headline result is that 92 of 228 studies got strong results (i.e., statistically significant, consistent evidence in favor of the hypothesis). Of these, 62% were published. In contrast, 49 studies got null results (i.e., no statistically significant difference between the treatment and control groups). Of these, just 22% were published. Another 85 studies got mixed results, and half of these were published. In other words, studies that got strong results were 2.8 times as likely to be published as those that got null results.
The figure below plots the results from both studies, with the share of studies with positive results that were published on the vertical axis and the share of studies with negative results that were published on the horizontal axis. The blue dots correspond to 8 different healthcare meta-analyses from Dwan et al. (2008), and the orange ones to four different categories of social science research in Franco, Malhotra, and Simonovits (2014). For there to be no publication bias, we would expect dots to lie close to the 45-degree line, on either side. Instead, we see they all lie above it, indicating positive results are more likely to be published than negative ones. The worst offenders are in the social sciences. Of the 60 psychology experiments Franco, Malhotra, and Simonovits study, 76% of positive results resulted in a publication, compared to 14% of null results. In the 36 sociology experiments, 54% of positive results got a publication and none of the null results did.

Franco, Malhotra, and Simonovits (2014) has an additional interesting finding. As we have seen, most null results do not result in a publication for this type of social science. But in fact, of the 49 studies with null results, 31 were never submitted to any journal, and indeed were never even written up. In contrast, just 4 of 98 positive results were not written up. In fact, if you restrict attention only to results that get written up, 11 of 18 null results that are written up get published - 61% - and 57 of 88 strong results that get written up get published - 64%. Almost the same, once you make the decision to write them up.
So why don’t null results get written up and submitted for publication? Franco, Malhotra, and Simonovits got detailed explanations from 26 researchers. Most of them (15) said they felt the project had no prospect for publication given the null results. But in other cases, the results just took a backseat to other priorities, such as other projects. And in two cases, the authors eventually did manage to publish on the topic… by getting positive results from a smaller convenience sample(!).
Why is this interesting? It shows us that scientists actively change their behavior in response to their beliefs about publication bias. In some cases, they just abandon projects that they feel face a hopeless path to publication. In other cases, they might change their research practices to try and get a result they think will have a better shot at publication, for example by re-doing the study with a new sample. The latter is related to p-hacking, where researchers bend their methods to generate publishable results. More on that at another time.
Less than Ideal Studies
These kinds of ideal studies are great when they are an option, but in most cases we won’t be able to observe the complete set of published and unpublished (and even unwritten) research projects. However, a next-best option is when we have good information about what the distribution of results should look like, in the absence of publication bias. We can then compare the actual distribution of published results to what we know it should look like to get a good estimate of how publication bias is distorting things.
Among other things, Andrews and Kasy (2019) show how to do this using data on replications. To explain the method, let’s think of a simple model of research. When we do empirical research, in a lot of cases what’s actually going on is we get our data, clean it up, make various decisions about analysis, and end up with an estimate of some effect size, as well as an estimate of the precision of our estimate - the standard error. Andrews and Kasy ask us to ignore all that detail and just think of research as like drawing a random “result” (an estimated effect size and standard error) from an unknown distribution of possible results. The idea they’re trying to get at is just that if we did the study again and again, we might get different results each time, but if we did it enough we would see they cluster around some kind of typical result, which we could estimate with the average. In the figure below, results are clustered around an average effect size of -0.5 and an average standard error 0.4.
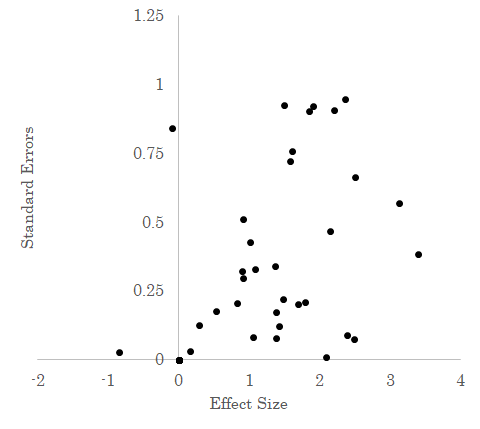
If we weren’t worried about publication bias, then we could just look at all these results and get a pretty good estimate of the “truth.” But because of publication bias we’re worried that we’re not seeing the whole picture. Maybe there is no publication bias at all and the diagram above gives us a good estimate. Or maybe results that are not statistically significant are only published 10% of the time. That would look something like this, with the light gray dots results that aren’t published in this example.
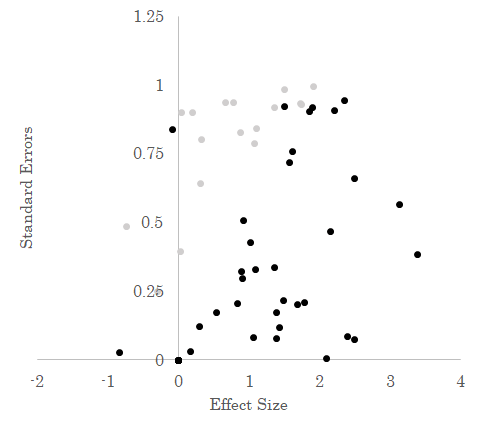
In this case, the unpublished results tend to be closer to zero for any given level of standard error. By including them, the average effect size is cut down by 40%.
What Andrews and Kasy do is show is that if you have a sample of results that isn’t polluted by publication bias, you can compare that to the actual set of published results to infer the extent of publication bias. So where do you get a sample of results that isn’t polluted by publication bias? One option is from systematic replications.
Two such projects are Camerer et al. (2016)’s replication of 18 laboratory experiments published in two top economics journals between 2011 and 2014, and Open Science Collaboration (2015)’s replication of 100 experiments published in three top psychology journals in 2008. In both cases, the results of the replication efforts are bundled together and published as one big article. We have confidence in each case that all replication results get published; there is no selection where successful or unsuccessful replications are excluded from publication.
We then compare the distribution of effect sizes and standard errors, as published in those journals, to an “unbiased” distribution that is derived from the replication projects. For example, if half of the replicated results are not statistically significant, and we think that’s an unbiased estimate, then we should expect half of the published results to be insignificant too in the absence of publication bias. If instead we find that just a quarter of the published results are not statistically significant, that tells us significant results are three times more likely to be published, since there are three times as many significant ones as insignificant, and we would expect them to have equal probability of being significant or insignificant. Using a more sophisticated version of this general idea, Andrews and Kasy estimate that null results (statistically insignificant at the standard 5% level) are just 2-3% as likely to be published in these journals as statistically significant results!
Now, note the important words “in these journals” there. We’re not saying null results are 2-3% as likely to be published as significant results; only that they are 2-3% as likely to be published in these top disciplinary journals. As we’ve seen, the studies from the previous section indicate publication bias exists but is usually not on the order of magnitude seen here. We would hope non-significant results rejected for publication in these top journals would still find a home somewhere else (but we don’t know that for sure).
Even Less Ideal Studies
This technique works when you have systematic replication data to generate an unbiased estimate of the “true” underlying probability of getting different effect sizes and standard errors. But replications remain rare. Fortunately, there is a large literature on ways to estimate the presence of publication bias even without any data on the distribution of unpublished results. I won’t talk about this whole literature (Christensen and Miguel 2018 is a good recent overview) but I’ll talk about Andrews and Kasy’s approach here, but plan to cover some of the others in a future newsletter.
Let’s go back to this example plot from the last section. Suppose we have this set of published results. How can we know if this is just what the data looks like, or if this is skewed by publication data?

As I noted before, statistically significant results are basically ones where the estimated effect size is “large” relative to imprecision of that estimate, here given by the standard error. For any point on this diagram, we can precisely calculate which results will be statistically significant and which won’t be. It looks sort of like this, with results in the red area not statistically significant.
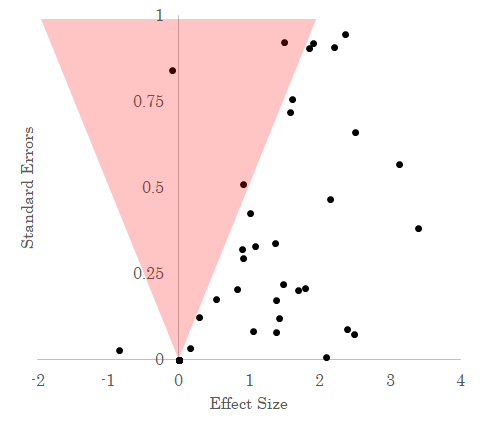
Notice the red area of statistical insignificance is eerily unpopulated; an indication that we’re missing observations (these are called funnel plots, in the literature).
What Andrews and Kasy propose is something like this: for a given standard error, how many do you see in the zone of insignificant results versus outside it. For instance, look at the regions highlighted in blue in the figure below.

If we assume that without publication bias there is no systematic relationship between standard errors effect sizes (i.e., without publication bias, a big standard error is equally likely for a big effect as a small one), then we should expect to see a similar spread of effect sizes across each rectangle. In the bottom one, they range pretty evenly from -1 to 3, but in the top one they are all clustered on around 2. Also, in the top area, most of the area lies in the “red zone” of statistical insignificance and so we should expect to observe a lot of statistically insignificant results there - the majority of observations, in fact. But instead, we just observe 1 out of 6 total observations statistically insignificant. This kind of information about the difference between what we should expect to see versus what we actually see can also be used to infer the strength of publication bias. In this case, instead of using replications to get at the “true” distribution, it’s like we’re using the distribution of effect sizes for precise results to help tell us about what kinds of effect sizes we should see for less precise results. After all, they should be basically the same, since usually an imprecise result is just a precise result with fewer datapoints. There isn’t anything fundamentally different about them.
Andrews and Kasy apply this methodology to Wolfson and Belman (2015), a meta-analysis of studies on the impact of the minimum wage on employment. They estimate results that find a negative impact of the minimum wage on employment (at conventional levels of statistical significance) are a bit more than 3 times as likely to be published as papers that don’t. Unlike the replication based studies, this estimate is a closer match to the results we found for the ideal data studies, where social science papers that found strong positive results were around 2.8 times as likely to be published as those that didn’t.
So, to sum up; yes - publication bias is a real thing. You can see it’s statistical fingerprints in published data. And when you’re lucky enough to have much better data, such as on the distribution of results that would occur without publication bias, or when you can actually see what happens to unpublished research, you find the same thing: positive results have an easier time getting published.
So what do you do about it? Well, you can find ways to reduce the extent of bias, for example by getting journals to precommit to publishing papers based on the methods and the significance of the question asked, rather than the results. Or you can create avenues for the publication of non-significant findings, either in journals or as draft working papers. Recall however that Franco, Malhotra, and Simonovits found most null results weren’t even written up at all - it may be that if non-significant work can be published in some outlets but will still be ignored by other researchers, researchers might not bother to write them up and instead choose to allocate their time to pursuing research that might attract attention.
Alternatively, if you can identify publication bias, you can correct for it with statistical tools. Andrews and Kasy, as well as others, have developed ways to infer the “true” estimate of an effect by estimating the likely value of unpublished research. Indeed, Andrews and Kasy make such a tool freely available on the web.
But we can also look more deeply at the underlying causes of publication bias. It turns out that the extent of publication bias varies widely across disciplines and sub-disciplines. That’s a bit surprising. Why is that the case? The plan for next week is to dig into precisely that question.
If you liked this post, you might also like:


Share this post