


Government Funding for R&D and Productivity Growth
Estimating the returns to public R&D, using data
This article will be updated as the state of the academic literature evolves; you can read the latest version here. You can listen to this post above, or via most podcast apps here.
What’s the return on government funding for research?
There are a few places in the academic literature you can look to for insight. Jones and Summers (2021) uses a hypothetical thought experiment to make the case that, on average, every dollar of R&D spent probably generates several dollars in benefits via its long-run impact on economic growth (see What are the returns to R&D? for more discussion). But that result applies only to R&D in general, government and non-government, bundled together. Is government funding above or below this average? This approach can’t say. Moreover, while I find it a compelling thought experiment, at some point we probably want to check the results against data.
On the other extreme, there are many papers that have looked at specific government programs to fund research – see the posts An example of high returns to publicly funded R&D and More science leads to more innovation for discussion of some of this work. While the work described there is grounded in careful empirical analysis, we may worry that the results from any specific government program are not representative of the impact of government research support more broadly.
Against this background, two recent papers – Fieldhouse and Mertens (2023) and Dyèvre (2024) – make progress in tackling the question of how federally funded R&D at large affects productivity growth. Fieldhouse and Mertens tackle this problem in a conceptually straightforward way. Taking the US as a whole, what has historically happened to US productivity after the federal government increases its spending on R&D? Does it go up? When and by how much?
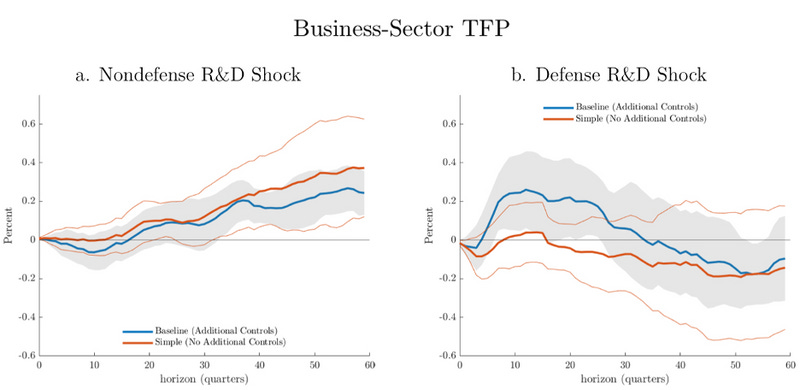
Using data on US productivity and defense and non-defense R&D, for the period 1947 to 2019, they find that, in general, a 1% increase in R&D “capital stock”1 by the federal government tends to be followed 8-15 years later by a 0.2% increase in national productivity.2 In the figure below, you can see the average correlation between productivity in the following 15 years and an increase in government defense and non-defense R&D. The red line is very simple; just the average correlation between R&D and productivity growth. The blue line is the link after we try to remove the influence on productivity of a bunch of other non-R&D factors: the capital utilization rate, lagged productivity, lagged R&D values, defense spending news, and a measure of stock market returns for various innovation sectors (designed to measure expectations about innovation). As you can see, these adjustments don’t actually much matter. Interestingly, non-defense R&D seems to have a stronger but more delayed impact on productivity, compared to defense R&D.
It can’t be that simple, can it? Well no. One problem is that changes in R&D don’t happen randomly. Changes in R&D spending reflect other things going on that might also impact productivity. Fieldhouse and Mertens worry in particular that changes in R&D may reflect changes in underlying national economic conditions. For example, it might be that R&D is treated like a form of economic stimulus: maybe we increase R&D spending when the economy slips into a recession. If R&D only changes when the economy slips into a recession, we might then confound the impact of a recession on productivity with the impact of R&D on productivity. On the other hand, sometimes we change R&D for reasons that are unlikely to be confounded with changes in the economy. For example, a geopolitical rivalry between the US and the USSR led to a massive expansion in R&D for space technology.
This latter type of R&D change seems like the kind that could actually be informative about how R&D affects productivity. To focus on this kind of R&D change, Fieldhouse and Mertens draw inspiration from a famous 1989 paper by Romer and Romer that tried to understand the impact of monetary policy. Even more so than government R&D spending, interest rate policy is adjusted in response to economic changes, so Romer and Romer faced a similar problem as Fieldhouse and Mertens. Their solution was to use their best judgment to identify cases in history where interest rates were changed for reasons other than fluctuations in economic output and study monetary policy in those cases. Fieldhouse and Mertens take a similar approach: they look at the five agencies most responsible for R&D, and identify 218 cases when these agencies’ R&D budgets undergo a particularly large revision (up more than 5% in a year, or down more than 2.5%). For each of these cases, they then examine primary sources to try and understand why the R&D budget was changed in that year. Using their judgment, they then split this sample of major R&D changes into two categories: changes motivated by changing economic conditions, and the rest. The figures and results above are what tends to happen to productivity after a change in R&D spending that isn’t caused by fluctuating economic conditions.
(How good is their judgment in classifying these R&D policy changes? For what it’s worth, it turns out that all this classification work doesn’t actually matter much for their overall results. They get similar results if they just use all the data.)
One potential concern is that, in addition to changing in response to economic conditions, R&D might be changed because policymakers anticipate R&D is likely to be particularly impactful (or not). For example, the launch of Sputnik might have communicated to US policymakers not only that they were falling behind technologically, but also that an increase in R&D spending for space was likely to bear fruit – after all, the Soviets had demonstrated certain feats in space were feasible. If changes in R&D are responding mostly to changes in “technological opportunity,” then this kind of result might overstate the benefits of R&D in general, though they try to control for that with stock market valuations of innovative sectors. But if you want to evaluate their judgments, the paper includes a 630 page(!) “narrative appendix” which contains the primary sources and classification of each R&D policy change. (As an aside, this seems like it could be a useful dataset on what drives changes in R&D spending!)
The connection between R&D and productivity is further strengthened by a set of other results that suggest changes in R&D spending also anticipate changes in various proxies for technological change. Increases in R&D appropriations are associated with later increases in the number of new PhDs, researchers, and the number of new scientific and technological books.
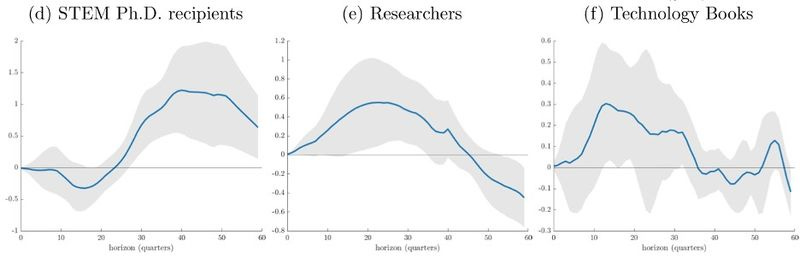
One bottom line of this paper is that, over the last 70 years, if you look at swings in US government funding for R&D, increases tend to be followed by more PhDs, more researchers, more books on technology, and, eventually higher productivity growth, again across the whole US. The advantage of focusing on productivity in the entire United States is that doing so casts a very wide net; you’ll pick up gains from R&D wherever they happen nationally. That’s important, because as I’ve written here, knowledge spillovers are a big deal in innovation. The gains to unanticipated beneficiaries of R&D often exceed the gains to the intended target. But the disadvantage of focusing on the productivity of the US as a whole is that you end up with a relatively small number of observations (about 70 years and one country).
Another way to tackle this problem is to focus on individual firms- there’s only one America, but there are lots of firms. If publicly funded R&D is improving national productivity growth, then we should also be able to observe an effect on the individual firms that make up the economy. Dyèvre (2024) takes this approach.3 By studying individual firms, Dyèvre is able to draw on a bit over 7,000 data points (different firms in different years). Instead of focusing on how overall US productivity changes in response to changes in overall R&D, he wants to leverage this data to test how an individual firm’s productivity changes after an increase in government R&D that is relevant to that firm.
What is relevant government R&D? Well, for a firm working on solar panels, research funded by the Department of Energy is probably more relevant than research funded by the National Institute of Health. And within the Department of Energy, research conducted during years when solar panel research was a priority is probably more relevant to a solar panel firm than research conducted during years when the Department of Energy’s focus was primarily on other things. But how to identify what kinds of research each agency is working on in a given year at scale?
Dyèvre uses the patents firms and government agencies hold as a way to assess the overlap of their research. For example, a firm working on solar panels is likely to hold patents classified in patent category H02S: generation of electric power by conversion of infrared radiation, visible light or ultraviolet light, e.g. using photovoltaic [pv] modules. The Department of Energy also gets patents for its inventions, and the years in which its patents are classified as belonging to patent category H02S are also the years in which it is more likely to be doing R&D relevant to that firm. Using variation in what kinds of technologies get patented across different agencies in different years, Dyèvre can trace out what happens to the productivity of energy/life science/aeronautics/etc. firms when the government increases its R&D spending respectively on energy/life sciences/aeronautics/etc.
Compared to simply looking at total government R&D and its impact on total national productivity, we get a lot more data and variation, at the cost of adding a bit of noise to our data, both because patenting does not perfectly reflect what firms are working on,4 and because sometimes firms may benefit (possibly indirectly) from R&D on topics different from their own. With this data, Dyèvre estimates that a 1% increase in government R&D is associated with roughly a 0.023-0.025% increase in productivity after 5 years.5 At the end of this post, I’ll try to assess whether this is the kind of level we should be impressed by.
One other paper lends a bit more support to the general conclusions of Fieldhouse and Mertens (2023). Policy analysts typically assume that the economic effects of R&D differ depending on whether the spending is for defense or nondefense purposes (see CBO 2018, for example). Fieldhouse and Mertens (2023) also separately analyze the impact of defense and non-defense government R&D on productivity, and generally find results supporting that distinction (non-defense R&D has a greater impact on productivity). This finding is also echoed in a third paper, Moretti, Steinwender, and Van Reenen (2025), which focuses more directly on government funded defense R&D.
Moretti and coauthors essentially create estimates of industry-specific spending on defense R&D across OECD countries (as well as firm-specific defense R&D contracts for French firms) and look to see what happens after changes in defense-spending on R&D specific to your industry or firm. They estimate that a permanent 1% increase in annual defense R&D spending in a particular industry is associated with an 0.08% increase in productivity growth in that industry. The way Moretti and coauthors set up their analysis, we should interpret this increase as the long-run increase.6 This is smaller than the long-run effects of non-defense R&D found by Fieldhouse and Mertens, but larger than the long-run effects of defense R&D they find (which were essentially nil).
One potential explanation for this intermediate result (stronger effects for defense R&D, but weaker effects for non-defense R&D than in Fieldhouse and Mertens) is that Moretti, Steinwender, and Van Reenen’s estimates of defense R&D spending might in fact be picking up a mix of defense and non-defense R&D. The paper does not separate out the two types of R&D spending, and they note across their countries the average correlation between national defense and non-defense R&D spending is 0.29. So it’s possible their predicted defense R&D is also correlated with unobserved non-defense R&D (which they’re not specifically controlling for), which would lead to productivity increases if we assumed the Fieldhouse and Mertens result is correct.
In the end we have three empirical papers that try to assess the broad effects of government support for R&D. One looks at the overall impact of government supported R&D on US productivity, another at the impact of specific slices of that R&D on firms that are likely to be most directly impacted. Both approaches find R&D generates significant productivity impacts. One of these papers (Fieldhouse and Mertens 2023) also separately analyzes defense and non-defense spending, finding the productivity effects of defense-related R&D are lower than non-defense ones. A third paper looking specifically at defense R&D (but for an international sample, not just the USA) also finds long-run effects of defense R&D that are lower than the long-run effects of non-defense R&D identified by Fieldhouse and Mertens.
What’s the ROI though?
So to respond to the question that kicked things off: what is the return to government funded R&D?
Let’s focus on Dyèvre (2024), which I think is easiest to interpret. Recall, he finds that a 1% increase in government R&D funding generates roughly a 0.024% increase in productivity after five years. Is that good?
As a benchmark, suppose that 100% of annual economic growth is driven by (100% of) annual R&D. This is basically the assumption made in Jones and Summers (2021), the paper I mentioned at the outset of this article, which argued that every dollar of R&D generates several dollars of GDP over the long run. Let’s suppose there is a constant relationship between R&D spending and growth, just as a benchmark. If that’s true, then we should expect a 1% increase in annual R&D to generate a 1% increase in annual growth.
That’s broadly consistent with Dyèvre’s results. Annual GDP per capita growth in the USA has been about 1.8% per year since the 1950s, so a 0.024% increase in productivity (as Dyèvre finds) is equivalent to a 1.3% increase in the annual rate of growth. That implies we’re actually getting more than 1% increase in annual growth for a 1% increase in R&D, especially given that government R&D is only a minority of overall US R&D.
To be clear, I wouldn’t take this exercise too seriously - there are a lot of subtleties you should adjust for to do this kind of exercise properly. But as a back of the envelope calculation, I think it’s quite consistent with the results of Jones and Summers (2021), which argued that we should expect a dollar of R&D to generate several dollars of GDP.
Thanks for reading! As always, if you want to chat about this post or innovation in generally, let’s grab a virtual coffee. Send me an email at matt@newthingsunderthesun.com and we’ll put something in the calendar.
If you want to read more, the following posts were mentioned above:
This is essentially a weighted sum of past R&D spending, where more recent spending counts for more. See Patent stocks and technological inertia for some more discussion of knowledge stocks.
How do they measure productivity? It’s basically the statistical gap between the market value of everything produced in the USA, adjusted for inflation, and all the productive inputs used to produce GDP, like labor and capital, adjusted for quality.
Dyèvre has been a collaborator on some other New Things Under the Sun posts: see The Size of Firms and the Nature of Innovation and Bigger Firms Have Different Incentives
See table 1, productivity measures. Note that this isn’t directly comparable with Fieldhouse and Mertens (2023), because they examine changes to the R&D stock, which is different from annual R&D appropriations.
They’re actually looking at R&D stocks, not flows, so increasing the stock by 1% requires a persistent increase in the annual R&D flow of 1% per year