New Things Under the Sun is a living literature review; as the state of the academic literature evolves, so do we. This post highlights some recent updates. One theme of this update is responding to feedback, which is always welcome. Thanks!
Thanks for reading What's New Under the Sun! Subscribe for free to receive new posts and support my work.
Peer Review
The article “What does peer review know?” surveyed some studies that compare peer review scores to long-run outcomes, both for grant proposals and journal submissions. It argues peer review scores do predict long-run outcomes, but only with a lot of noise. Misha Teplitskiy pointed me to some additional papers on this topic, which reinforced this point. The updated article now includes the following section.
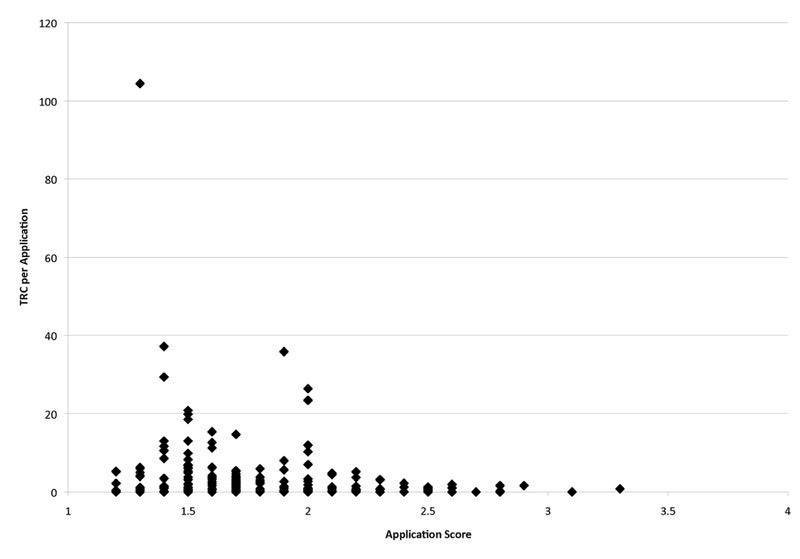
Gallo et al. (2014) obtain pretty similar results as above for the peer review scores of the American Institutes of Biological Sciences, an organization that provides expert peer review services for clients. In the figure below, on the horizontal axis we see the peer review scores for 227 projects reviewed by American Institutes of Biological Sciences peer reviewers that were ultimately funded. These range from 1 (the best) to 5 (the worst) (note the figure stops at 4; no projects receiving a score worse than that were funded). On the vertical axis we have a normalized count of all the citations to publications that emerged from the grant. As with the NIH data, we again observe a noisy but pretty consistent relationship: the better the peer review score, the more citations eventually earned.1
From Gallo et al. (2014)
Clavería et al. (2000) obtains similar results in a review of 2,744 proposals funded by the Spanish Health Research Fund over 1988-1994. In this case, the peer review data available is pretty coarse: Claveria and coauthors just know if reviewers classified projects as “excellent/good”, “acceptable”, or “questionable/rejected.” However, a distinguishing feature of this study is that in 1996 the authors arranged for each of these proposals to be reviewed retrospectively by new reviewers. These reviewers looked at the original proposals, the annual and final reports, and published papers originating from the project, and assigned each of the now-completed proposals a score of 1-10 (higher is better) for its actual scientific performance. So, if we are concerned that quantitative indicators like citations or publication counts are inappropriate ways to evaluate science, this study gives us a more holistic/subjective assessment of research quality.
The study again finds that peer review scores are noisily correlated with measures of quality. Spanish Health Research Fund proposals were reviewed by two commissions, one comprised of experts with topical expertise, and one with experts from related fields. After controlling for research level, duration, budget, and year of project onset, projects that received an “excellent/good” review at the proposal stage from the related field commission were rated 0.3 points higher when the completed projects were reviewed (recall, on a ten point scale). An “excellent/good” review from the commission with more direct topical expertise was associated with a 0.7 higher rating. (If you do not adjust for research level and others, the association is a bit stronger). Again - better peer review scores seem to be associated with better outcomes, but the association isn’t super strong (for context, the average rating for completed projects was 5.0/10).
The rest of the article turns to similar evidence from peer review reports to journal submissions.
Turning to the effects of peer review and editor discretion on publication bias, the article “Publication bias without editors? The case of preprint servers” looks at the causes of publication bias. It could be that publication bias arises at the journal submission stage; maybe editors and peer reviewers screen out papers that find non-significant results? The article looks at preprint servers to see if that’s so, and argues such a process is not the main driver of publication bias. It is not merely the case that reviewers bounce all the papers that are submitted but obtain results that are not statistically significant. Instead, such papers do not seem to even be written up and submitted.
A new paper by Brodeur et al. provides quite clear evidence of this dynamic by following submissions and publications at the Journal of Human Resources. I’ve incorporated discussion of that paper into a discussion of another (Broderick, Cook, and Heyes 2020), already covered in the original version of the article. We pick up after describing how you can identify the statistical fingerprints of p-hacking by looking for a suspicious pileup of test-statistics that are just barely statistically significant (and hence, perceived to be publishable).
Brodeur, Cook, and Heyes (2020) and Brodeur et al. (2023) look for [a] suspicious pileup right above the conventional thresholds for statistical significance. The set of four figures below plot the distribution of two kinds of test statistics found in various samples of economics papers. The top row, from Brodeur, Cook, and Heyes (2020) plot the distribution of something called a z-statistic, which divides a normalized version of the effect size by an estimate of precision. A big z-statistic is associated with a precisely estimated effect that is large - those are places where we can be most confident the true effect is not actually zero. A small z-statistic is a small and very imprecisely estimated effect size; those are places where we worry a lot that the true effect is actually zero and we’re just observing noise. The bottom row, from Brodeur et al. (2023) plots a closely related statistic, a p-value, which is (colloquially) the probability a given set of data would arise simply by chance, if there is no genuine effect out there.
Top row from Brodeur, Cook, and Heyes (2020), bottom row from Brodeur et al. (2023)
There are two interesting things we can read off this figure. First, we look to see if there is a suspicious pileup right above (for z-statistics, so top row) or below (for p-values, so bottom row) important thresholds. Those thresholds are indicated by vertical lines and each distribution shows spikes of test statistics just barely in the statistically significant range. In other words, lots of papers just happen to be finding with results that are barely statistically significant by conventional standards.
The second interesting thing relates to the similarity of these patterns across the four figures. In the top-right, we have the distribution of test-statistics from papers published in top 25 economics journals in 2015 and 2018. In the top-left, Brodeur and coauthors go back and identify published pre-print versions of these papers and do the same analysis. For the purposes of the current discussion, the main point is that this anomalous distribution of test statistic results is already there in the working paper stage. If we interpret this as evidence of p-hacking, it’s telling us that researchers don’t do it when reviewers complain - they do it before they even submit to reviewers.
A limitation of the top row is that we don’t actually see how peer review affects what gets published. We started with the set of published papers, and then looked back to see what those papers looked like when they were just working papers. But we don’t know if the stuff that wasn’t published was better or worse, in terms of evidence for p-hacking.
That’s where the second row comes in. Although it’s a more limited sample, in the bottom left we now have a large sample of papers that were submitted to one particular journal. In the bottom right, we have the papers that ended up being published. Again, there’s not a large difference between the two. It’s not really the case that economists submit papers without much evidence of p-hacking but then peer reviewers only publish the stuff that exhibits signs of p-hacking. If it’s there, it’s there from the start.
(Aside - Brodeur et al. 2023 actually finds some evidence that editors are a bit more likely to desk reject papers with results that are just barely statistically significant, while peer reviewers display the opposite tendency. The two effects seem to mostly wash out. For more on the relative merits of accountable individual decision-makers, such as editors, relative to peer review, see Can taste beat peer review?)
The preceding argued that publication bias ultimately stems from researchers anticipating a better reception for papers that obtain statistically significant results. But as highlighted in “Why is publication bias worse in some disciplines than others?” an additional puzzle is why this problem seems to be worse in some fields. I’ve updated this article to incorporate discussion of Bartoš et al. (2022), which uses more sophisticated methods to assess the extent of publication bias across different fields.
After discussing how different forms of publication bias can lead to unusual distributions of statistical test statistics, and how Bayesian model averaging can leverage those distortions to assess the likelihood of different forms of bias, the post continues:
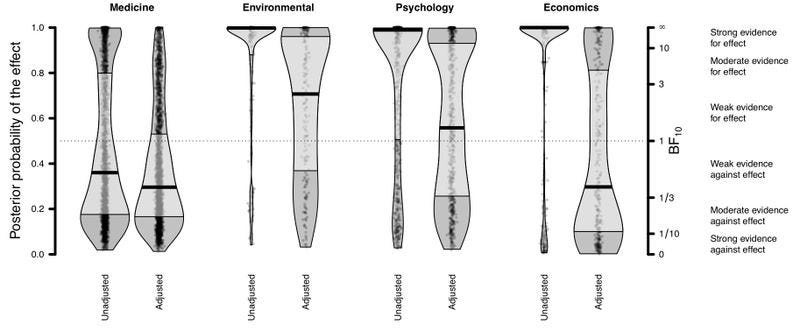
Bartoš et al. (2022) identify about 1,000 meta analyses across environmental sciences, psychology, and economics, covering more than one hundred thousand individual studies (the lion’s share in economics), and another 67,000 meta-analyses in medicine that cover nearly 600,000 individual studies in medicine. For each field, they see how likely it is that different sets of assumptions would generate data displaying these patterns, and then how likely it is that each of these models is “correct.” Lastly, once they have the probability all these different models are correct, they can “turn off” publication bias in their models to infer the actual distribution of effects seen in the data, rather than just the ones that make it into journals. The figure below compares the distribution of findings in the literature (“unadjusted”) to what you find after using models to try and strip out publication bias (“adjusted”).
From Bartos et al. (2023)
For their sample, publication bias in economics, environmental sciences, and psychology are much worse than in medicine (though comparing among these three depends on which measure of publication bias you prefer).
The post also reviews other evidence of variation in bias across fields, and then goes on to argue variation is at least partially explained by variation in the reliability of empirical methods across fields. In disciplines where empirical methods are not that reliable, it’s easier to discount results that go against theory as reflecting noise/error, rather than disclosing true knowledge about the world.
My latest post, written in collaboration with Arnaud Dyèvre, was called “Big firms have different incentives” and part of it argued that larger firms are more likely to engage in process innovations, which are harder to observe. After publishing, we were contacted by Fernando Galindo-Rueda from the OECD, who drew out attention to another dataset on this question (thank you!). We’ve incorporated discussion of this into our post, noting that the interpretation of this data is our own, and may or may not reflect Galindo-Rueda’s views.
After noting some reasons to think process innovations may be harder to observe, and presenting some patent-based evidence that larger firms do more process innovation, the post continues:
We also have some non-patent evidence, though it’s unsatisfying in some ways. The US Census and NSF jointly sponsor the American Business Survey, which asks firms if they have engaged in any product or process innovation in the last two years, and also includes data on the size of firms. The trouble is the question only lets us see if firms do any product or process innovation, not how much they do. It helps us measure going from 0 to 1 product/process innovation, but not from 1 to 2 innovations. Measuring the shift from 0 to 1 is probably most representative of overall R&D activities for relatively small firms, which are least likely to do any innovation. And for relatively small firms, the 2020 survey finds that as firms get bigger, the likelihood they report a process innovation rises faster than the likelihood they report a product innovation. But once firms start to get bigger than 50 employees, this relationship reverses.
But that isn’t necessarily inconsistent with large firms focusing more on process innovation. Maybe large firms go from 1 process innovation to 10 as they get big, but only go from 1 product innovation to 2. That kind of shift wouldn’t be reflected in this survey, which is focused on measuring the 0 to 1 shift in innovations. Akcigit & Kerr (2018) are able to match Census data on U.S. firms to a more comprehensive survey of R&D activities by the NSF, which lets us see the share of R&D dedicated to process innovation. They find a positive correlation between firm size (defined here as log employment) and the share of R&D dedicated to process innovation. But unfortunately, it’s an old survey, covering 1979-1989.
All in all, the patent-based evidence suggests larger firms do more process innovation than product innovation, and we think the survey data is a bit murky, but also consistent with that claim.
There were also a variety of other updates on New Things Under the Sun, which do not revolve around new academic research:
I updated the overview article “How to accelerate technological progress” to incorporate discussions of peer review, the size of firms, and local learning. These were all topics that were discussed in New Things Under the Sun over this year.
The site indices have been reformatted to look cleaner and be a bit easier to use (I hope!)
Odds and Ends
The website New Things Under the Sun is two years old as of August 30! The project had existed prior to that as an email newsletter, but the launch of the website is when it came to “life” in the sense that it became a living literature review subject to updates of the type you just read. By the numbers it has:
68 claim articles
3 argument articles
13,800+ subscribers to the newsletter
Friend of New Things Under the Sun, the Institute for Progress (where I am a senior fellow) just launched a new interview series, Statecraft, about how policymakers actually get things done. You can subscribe here! It’s a newsletter about how exactly successful government initiatives happen, and a set of roadmaps for readers trying to get big things done.
The Institute for Replication (an Open Philanthropy grantee) is looking for researchers interested in replicating economic and political science articles. Research using non-public data is a formidable barrier for reproducibility and replicability - so they are offering up to 5,000 USD and coauthorship on a meta-paper combining hundreds of replications. A list of studies of eligible studies is available here, with payment info. Please contact instituteforreplication@gmail.com for more detail and indicate which study you would like to replicate. They are interested in 3 types of replications: (i) using new data, (ii) robustness checks and (iii) recoding from scratch.
Open Philanthropy’s Innovation Policy program is currently soliciting pre-proposals from individuals for financial support to write living literature reviews about policy-relevant topic areas. Interested individuals should have a PhD related to their proposed area and should contact matt.clancy@openphilanthropy.org for more information.
Until Next Time
Thanks for reading! As always, if you want to chat about this post or innovation in generally, let’s grab a virtual coffee. Send me an email at matt.clancy@openphilanthropy.org and we’ll put something in the calendar.
While the absolute top-scoring proposals perform worse than slightly lower scoring ones in this paper, I think the data is noisy enough that we shouldn’t read too much into the fact.