Like the rest of New Things Under the Sun, this article will be updated as the state of the academic literature evolves; you can read the latest version here.
Note: An audio version of New Things Under the Sun is now available on all major podcast platforms. Apple, Spotify, Google, Amazon, Stitcher
Think of new technologies as proceeding through a set of stages:
Basic scientific research that explores phenomena
Applied research to better understand how to harness certain phenomena
Technology development to capture and orchestrate phenomena for a purpose
Marketing and diffusion of the new technology
The real world can be more complicated with back-and-forth interplay between the stages, but this is a fine place to start.1 If you want to shape the direction of technology, you can intervene early in this process and try to push the kinds of technology you want onto the market, by subsidizing research.2 Or you can intervene at the end of the process and try to pull the kinds of technology you want into existence by shaping how markets will receive different kinds of technology.
One specific context where we have some really nice evidence about the efficacy of pull policies is the automobile market. Making fuel more expensive or just flat out mandating carmakers meet certain emissions standards seems to pretty reliably nudge automakers into developing cleaner and more fuel efficient vehicles. We’ve got two complementary lines of evidence here: patents and measures of progress in fuel economy. In this post, first I’ll go over the evidence, and then I’ll talk a bit what I think we should take away from it. In my view, we have strong evidence that pull policies work well for incremental progress, but the case for their efficacy at promoting radical innovation is a lot shakier.
Patents, Progress, and Pull Policies
One pull policy is a tax on undesirable technologies, since, all else equal, that makes the taxed technology less profitable to develop and alternatives more profitable to develop. A carbon tax is the most famous example of this kind of policy. Aghion et al. (2016) are interested in how a carbon tax might change innovation in the auto sector, but given how rarely anyone actually tries to implement a carbon tax, they can’t directly study the question. Instead, they do the next best thing. From the perspective of a carmaker, one of the main effects of a carbon tax is to raise the price of fuel. So how do carmakers respond to higher fuel prices?
To answer that question, they need a way to measure innovation. More specifically, they want to measure the kind of innovation a firm decides to do: do carmakers focus on clean technology (electric, hydrogen fuel cell, and hybrid vehicle) or conventional fossil fuel innovation? Patents are a useful dataset for this kind of problem, since they are correlated with inventive effort and can be easily categorized into different kinds of technology. One problem though is that patents vary tremendously in how valuable they are. Some are very important, but a lot are junk. So Aghion and coauthors focus on the subset of patents for which the patent-holder sought patent protection in three big markets: the USA, the European Union, and Japan. Since it’s costly to apply for a patent in each market, doing so in all these markets is a signal that the inventor thinks the patented invention is sufficiently valuable to be worth protecting in multiple large markets. So in this paper, you can think of them measuring innovation by counting the number of valuable patents for different kinds of automobile technology.
In an ideal setting, if we really wanted to assess the impact of fuel prices on the innovation decisions of carmakers, we would want to randomly assign some carmakers to face higher fuel prices than others. Then we could compare the subsequent patenting behavior across groups facing different fuel prices. And if we wanted to establish this robustly, we would want to do this kind of experiment many times.
We can’t do that. But Aghion and coauthors do something that gets you closer to this ideal. The price of fuel varies a lot from year-to-year, thanks to fluctuations in the price of oil (see left figure below), but it also varies a lot from country-to-country, because countries vary substantially in the size of their taxes on fuel (see right figure below).

Moreover, carmakers typically sell to multiple countries, but have different footprints in different countries. Aghion and coauthors reason that carmakers are more sensitive to (tax-inclusive) fuel prices in the countries where they have a larger share of their total sales. For example, in the figure above it’s clear that the UK raised taxes pretty substantially over the 1990s, while taxes remained flat in the USA. In other words, if we have two carmakers, one with most of its sales in the USA and some in the UK, and another with most of its sales in the UK rather than the USA, then these carmakers are effectively facing different fuel prices. The carmaker selling primarily to the UK sees an increase in effective fuel prices, and we can compare their behavior to the one selling primarily in the USA.
For every carmaker, Aghion and coauthors construct an “effective” fuel price that is specific to that carmaker, by weighting the fuel price in each country by the carmaker’s exposure to that country. They estimate this exposure from the share of patents the carmaker seeks protection for in that country over 1965-1985, because generally you don’t bother seeking patent protection in countries where you don’t plan to operate in the future. They then look to see how the patents of carmakers differ in the subsequent 20 years (1985-2005) as each carmaker faces a different effective fuel price. We can then compare the behavior of firms that were established in markets that went on to have higher fuel prices to the behavior of firms that were established in markets that went on to have lower fuel prices.
(Note that they estimate the markets where a firm is established over 1965-1985, but look at the effect of fuel prices over 1985-2005; this prevents their results from being driven by innovative fuel efficient companies entering markets when they raise taxes, or from their measure of exposure to different markets from being whipped around by subsequent patenting activity)
Aghion and coauthors find fuel prices exert a powerful impact on innovation. A 10% increase in the effective price of fuel (that a specific carmaker is exposed to) is associated with roughly 5% fewer patents of the conventional “fossil fuel” type, and a 10% increase in clean energy patents.
Rozendaal and Vollebergh (2021) adapt this strategy to study the impact of emissions standards on auto innovation (in addition to fuel prices). Emissions standards are essentially a requirement that a carmaker’s average CO2 emissions per mile fall below some target by some date. It’s not actually quite that simple; but that’s the gist of the idea. Just as fuel prices differ across time and space, so to do regulatory standards. And just as a carmaker is more likely to care about the fuel prices in markets where it has a lot of sales, so too is a carmaker more likely to care about the emissions standards of markets where they have a lot of sales.
Rozendaal and Vollebergh make one of those kinds of observations that is obvious in retrospect but which some previous papers apparently missed. In terms of its impact on the rate and direction of innovation, what matters is not whether a country has an emissions target, or even if this target is high or low. What matters is (1) how high or low is this target relative to today’s average emissions and (2) how long do carmakers have to meet the target? If the standard is high, but you’ve already cleared it, then even though it’s high it imposes no extra incentive to innovate. On the other hand, if the standard is high and you have not met it yet, but actually have a long way to go to meet it, then it matters whether you’ve got ten years or one year to get there. If you don’t account for this kind of thing, it might look like standards don’t have much of an impact on innovation.
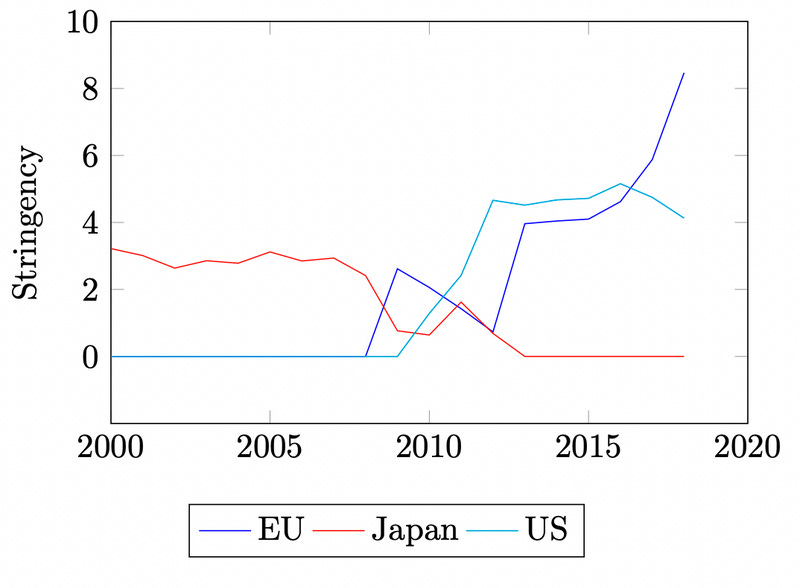
Rozendaal and Vollebergh construct a measure of standards that takes all this into account: it’s basically the difference between the average emissions of a country and the target, divided by the number of years left to meet the target. When the number is large, it means the average car in the country has a long way to go before it meets the target, and not a lot of time to get there. Here’s how their measure looks for the big three markets.
As with Aghion and coauthors, Rozendaal and Vollebergh construct estimates of each carmaker’s exposure to these three major markets, as of the year 2000. Those heavily exposed to Japan, for example, faced stronger incentives to innovate in the 2000s, compared to those heavily exposed to US and EU markets. But after 2010, the situation has largely reversed. Again, Rozendaal and Vollebergh are going to look at valuable patenting of clean and dirty technology in response to these measures of emission standards stringency (in addition to fuel prices).
And they find these pull policies work. A 10% increase in the stringency standards is associated with 2% more clean patents. Also importantly, Rozendaal and Vollebergh confirm Aghion and coauthor’s finding that fuel prices matter, albeit the strength of the relationship is weaker than Aghion and coauthors find. This might be because they are looking at a very different time frame, 2000-2016 compared to 1985-2005.
What I like about these studies is that they have thousands of different inventive entities, and each of these entities is, at least in principle, facing a “pull policy”of a different strength (based on the mix of markets they operate in). This lets you estimate pretty precisely how effective these policies are. Of course empirical economics is hard and these papers have a few potential weaknesses too. Among these is their reliance on patents as a measure of innovation. So let’s turn to a complementary strand of the literature that doesn’t rely on patents at all. The trade-off will be that we no longer have measures of the rate of innovation for quite as many different organizations facing different policies. Then, after that, I’ll point to a few more reasons for caution about these results.
Directly Measuring Fuel Efficiency
Presumably, the reason policymakers are interested in shaping the direction of progress in automobiles is that they want to encourage innovation that makes cars more fuel efficient. Ideally, we would want cars to be zero emission vehicles. So why not simply measure fuel efficiency directly, if that’s what we care about? We don’t actually care about patents, but results.
The challenge here is that you can improve fuel efficiency without innovating. You can make lighter cars, or cars with smaller engines with less horsepower. In general, cars have a lot of attributes and some of those attributes are associated with a reduced fuel efficiency. So if you want to measure technological progress, what we really need to do is see if cars get more fuel efficient without changing any of these other attributes. And that is precisely what another strand of literature tries to do.
Knittel (2011) has data on the models of practically all consumer vehicle models sold in the USA between 1980 and 2006: approximately 14,000 cars and 13,000 light trucks. For each of these vehicles he has data on their attributes, most importantly weight, horsepower, torque, and fuel efficiency (as measured in miles per gallon). As illustrated in the figure below, there is a tradeoff between each of these attributes and fuel efficiency. In general, models with higher weight, horsepower, or torque, have lower fuel efficiency. But what’s interesting is to compare the shape of this tradeoff at the beginning of the sample (in 1980) to the end (in 2006). For any of these attributes, if you pick a level you want, it tends to be feasible to get much higher fuel efficiency in 2006 than in 1980. The gap between these curves is a fairly direct measure of technological progress.
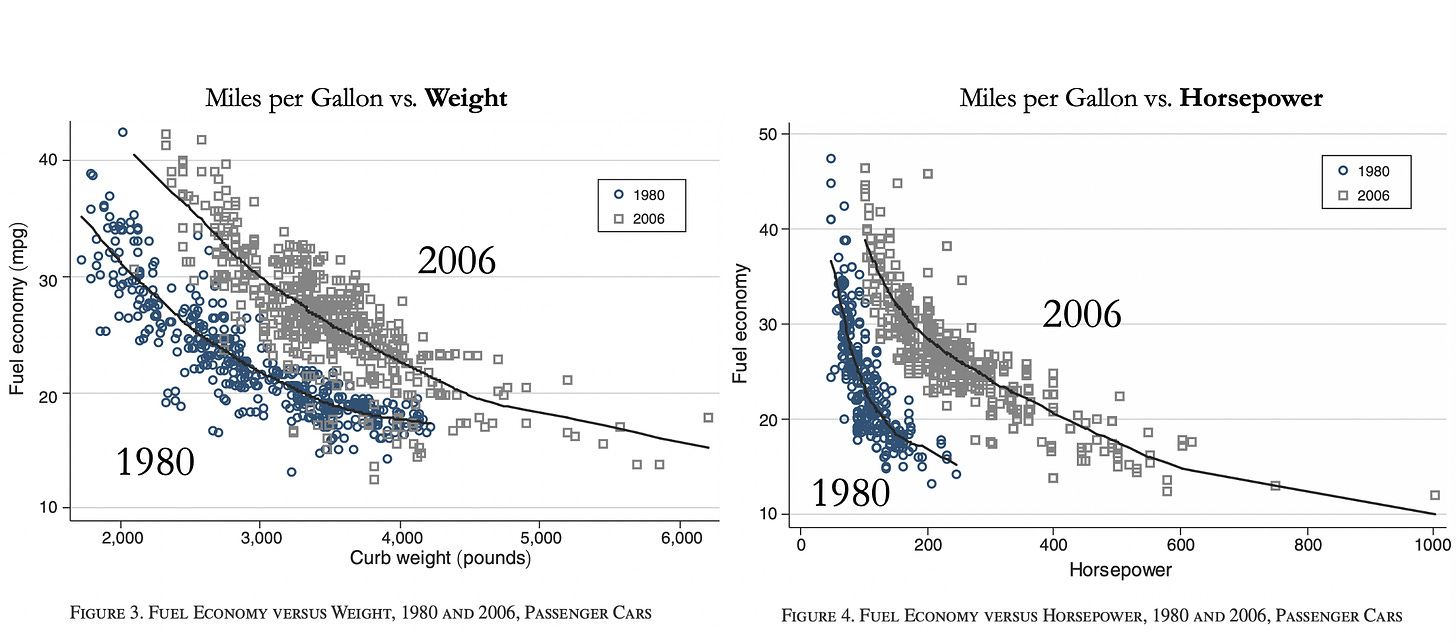
What Knittel ends up with is year-by-year estimate of the state of US auto fuel efficiency technology; that is, on average, how much more fuel efficient can you make a car, compared to one with the same attributes in 1980. He can then look at how this measure changes over time to assess the rate of technological progress. The results of Aghion et al. (2016) and Rozendaal and Vollebergh (2021), which were based on patents as a measure of innovation, imply that we should see the fastest technological change during periods of elevated US fuel prices and when US fuel economy standards were most stringent (relative to current levels). And that’s basically what Knittel finds - a 10% increase in the fuel price was associated with 0.3% faster technological change, and a 10 percentage point increase in fuel economy standards was associated with one percentage point faster technological progress.
Klier and Linn (2016) builds on this approach to run the sort of larger-scale statistical tests that Aghion et al. (2016) and Rozendaal and Vollebergh (2021) did with patent data. Klier and Linn estimate technological progress over 2000-2012 for US car models and 2005-2010 for Europe, a period during which the US and EU began implementing some new emissions regulations. Unfortunately for the economists, each of these regulations applied to all cars or trucks, which made them less useful for testing their efficacy, since ideally we would like to compare the behavior of firms that face regulations to those that don’t. But as with Rozendaal and Vollebergh, Klier and Linn exploit the fact that the same regulation can impose different burdens on different car companies. Specifically, manufacturers whose models are far from meeting the standards have a lot more work to do than those who are close to meeting the standard (or who already have met them). So Klier and Linn’s idea is to construct manufacturer-specific measures of stringency based on how far each manufacturer needs to tug up the fuel efficiency of its fleet, and then see if we observe faster technological progress among the cars of manufacturers who faced more stringent regulations from their point of view.
And we do. For every standard deviation increase in the stringency standards faced by a firm, technological improvement in US cars improved by an extra 0.5 percentage points per year, US trucks improved by an extra 1.5 percentage points per year, and EU cars improved by an extra 0.3 percentage points. Compared to baseline rates of improvement in the range of 1.4-2.0% per year, this isn’t bad.
So this is overall reassuring. We’re not touching patents at all with these two papers, but we still observe faster technological progress during the periods that the other patent-based papers suggest we should see it. But maybe we’re still worried that we haven’t properly controlled for everything in our statistical models. There were also recessions and sky-high fuel prices during 2000-2012, after all. Klier and Linn attempt to control for this, but it’s challenging. So let’s look at one last paper, Kiso (2019), which tries to exploit an unusually clean setting to test the effect of emission standards.
Kiso’s basic idea is to identify a setting that is very close to an experiment where we have two identical groups, and then we change one variable for one group but not the other. He looks at cars sold in the USA over the period 1985-2004. This was a twenty-year period during which US fuel prices were relatively stable and emissions standards in the US and EU were also fairly stable.
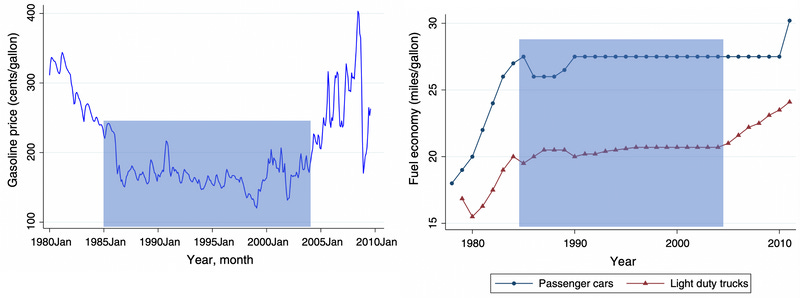
But during this period, Japan instituted emissions standards on vehicles sold there. These policies were announced in January 1993, with a deadline to hit the targets by the year 2000. In March 1999, a new set of targets were established for the year 2010. As indicated below, different vehicle weights had to hit different targets.
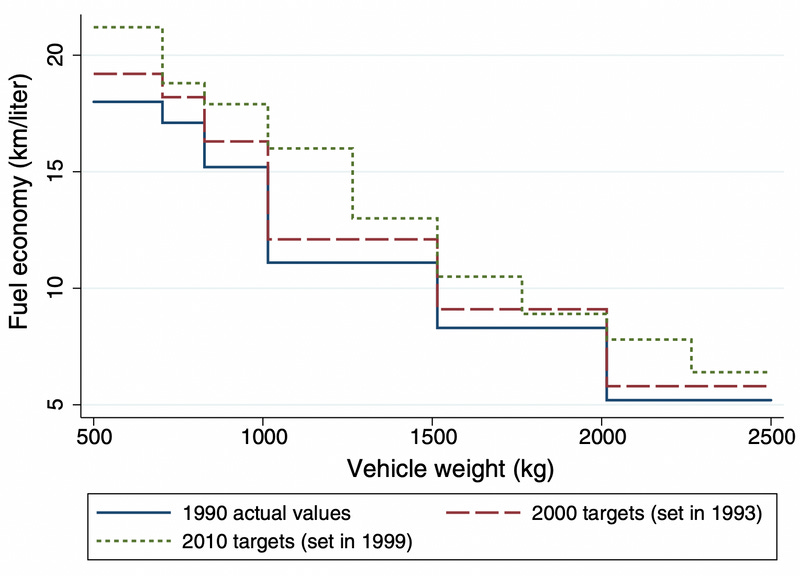
During this era, US and EU sales into Japan were tiny as a share of their total sales, whereas Japan was obviously a large and important market for Japanese carmakers. So obviously Japan was more incentivized over this period to improve fuel efficiency than US and EU carmakers, who are facing relatively stable prices and no major new emissions standards in their major markets. But the thing is, Japan is under no obligation to sell the same cars in Japan and the USA (and in fact it does not). So it could have been that Japan sold small fuel efficient cars in the Japanese market, and larger less fuel efficient cars in the US market, where emissions standards were relatively lax.
But the thing about ideas is they have a tendency to spill over into new applications. If you discover ways to make cars more fuel efficient without sacrificing other desirable vehicle characteristics, there is no reason you couldn’t apply those ideas to all the cars in your fleet. So Kiso’s idea is to use the methods of Knittel (2011) and Klier and Linn (2016) to compute the rate of technological progress (in fuel economy) for cars sold in the USA for Japanese carmakers and then to compare that to the rate of progress for cars sold in the USA from US and EU carmakers. If there’s a systematic difference beginning after 1993, when Japan introduced tighter standards, that’s evidence that the standards induced technological progress which spilled over into Japanese carmaker’s models in other countries.
And that is basically what we see. The figure below is the fuel efficiency gap, holding fixed car characteristics, between the US models of Japanese carmakers and the US models of US/EU carmakers. Beginning a few years after the policy announcement in 1993, the cars of Japanese carmakers have persistently better fuel economy than the US and EU cars. I’ve highlighted the three different relevant time periods in the figure below. Note the region highlighted in gray, which I call “out of sample” corresponds to a period when rising fuel prices and tightening emissions standards in the US muddy our interpretation of Japan’s emissions standards (since we now have multiple things changing at the same time).
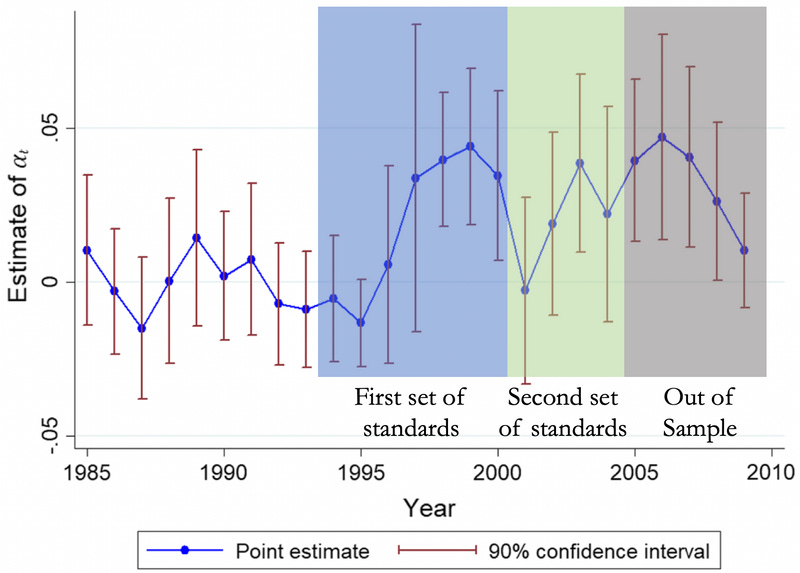
Taken together, over 1995-2004, fuel economy technology was 2.3-3.3% higher per year for Japanese carmakers (depending on whether you include or exclude the lightest and heaviest cars) as compared to US and EU carmakers.
How far can we extrapolate this?
I think this is pretty compelling. Aghion et al. (2016) tells us fuel prices exert a strong effect on the direction of technological progress, as measured by patents. Five years later, Rozendaal and Vollebergh (2021) use the same approach on a newer slice of the data, showing that effect is still there, albeit weaker. They also show that emissions standards, measured properly, exert the same kind of effect. Then, Knittel (2011) and Klier and Linn (2016) show that measures of technological progress which are based on the actual attributes of vehicles, rather than counting patents, also accelerate during times of high fuel prices or more stringent standards. Finally, Kiso (2019) shows that even when you restrict your attention to the set of cars sold in one market with broadly stable fuel prices and emissions standards, you can detect technological progress speeding forward among the cars of automakers who are, in separate markets, facing pressure to meet higher emissions standards.
At least for cars, pull policies work.
Moreover, we can extend this conclusion beyond auto markets. There is also a slew of studies (some of them briefly mentioned here) that find higher energy prices are associated with more patenting in various renewable energy technologies (like solar, wind, or battery technologies). And in healthcare, a lot of work has also shown that firms increase R&D on diseases that become more profitable to treat. Lastly, we may want to think of Operation Warp Speed, which successfully accelerated the development of highly novel mRNA vaccines by placing huge advance orders for vaccines that had not yet been validated (among other things).
How far should we extrapolate these results? Should we conclude that pull policies usually work? That we should use them for pretty much everything?
I think there are a few things to keep in mind before going that far.
First, one big caveat with all these studies on emissions standards is we can’t quite think of these standards as being just randomly selected. It may be that more ambitious standards are set precisely when new technological opportunities make it feasible to reach those targets. That doesn’t mean the standards don’t work, since technological advances that were possible might not have happened without the standards. But it does mean we need to be cautious about extrapolating from this setting to settings where technology is in a murkier state.
In fact, at least in the context of the EU standards, a 2021 paper by Reynaert provides some evidence that the ambitions of these standards were carefully matched to what experts at the time believed was technologically feasible. For example, he notes:
The EU Commission relied on several studies to support the design of the EU emission standard [....] The policy report only includes possible technology adoptions that should be readily available for the car makers at no fixed or development costs. In designing the regulation, the policymaker clearly had the channel of technology adoption in mind.
I think this suggests the results might be overstated to some degree: to some extent more stringent policies lead to more rapid technological advance, but it’s also true that more stringent policies are also selected when more rapid technological advance is feasible.
Second, and related, recall the simplistic model of technology development I mentioned at the beginning of this piece. New technologies start with basic exploratory science, move into applied research and then technology development, before finally marketing and diffusion. In this other piece, I looked at some evidence that profit incentives worked quite well for the latter stages of health-related R&D, but relatively poorly for initial stages. Specifically, the profit motive’s effect on the development of drugs farther from being market ready appears to be pretty weak.
Can we say the same thing about cars? That this policy is great for speeding up incremental change which is already close to being commercially viable, but poorly suited for more transformative and radical technological change?
As we would expect if the regulations were designed to enable the adoption of already existing technologies , it does seem that technological change in this context was largely incremental. That said, it’s a bit tough to be sure since few papers look specifically at this. However, both Reynaert (2021) and Knittel (2011) discuss the kinds of technological changes that helped bring about higher fuel efficiency. Knittel has the following charts, showing how various new technologies get integrated into more and more cars over time. This is innovation of a sort, but this chart implies a lot of the technology gains came from more and more cars adopting existing technologies that had already been successfully proven elsewhere.
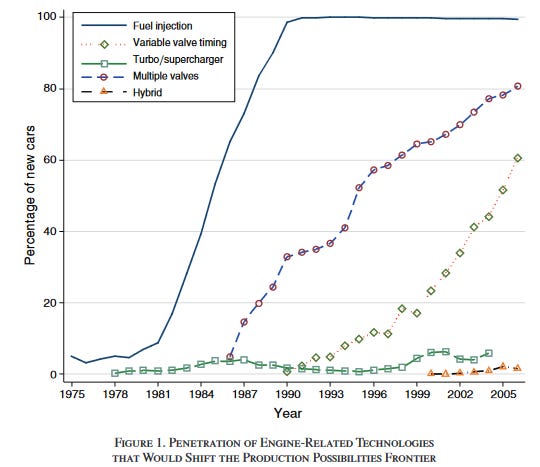
Klier and Linn (2016), as well as Reynaert (2021) doesn’t even call this “innovation” in their papers, preferring to use the phrase “technology adoption” to describe the process of car models becoming more fuel efficient. I tend to think it’s still a form of innovation - the vehicles had to be redesigned to incorporate these changes - but it’s innovation at its most incremental.
We can also turn to some other literature that attempts to describe how much different technologies rely on science for innovation. Ahmadpoor and Jones (2017) is a paper that computes how “close” a technology is to science by looking at how long is the chain of citations connecting an academic article and a patent. Auto-related technologies have pretty long chains by this metric. Patents pertaining to the internal combustion engine, motor vehicles, and electricity transmission to vehicles all having a mean distance to science exceeding 4, meaning on average the shortest link between a patent in one of these fields and a scientific journal is the patent cites a patent that cites a patent that cites a patent that cites a journal article. And a large share of patents never reach a scientific paper at all.
You can see how this stacks up against other technologies in the figure below; the horizontal axis is the length of a citation chain between patents and papers (the further the right, the further from science) and the vertical axis is the share of patents with any linkage to science (the lower, the less connected to science).

Both axes suggest auto technology is historically not dependent on science. And if you don’t like patent citations, this is also indicated by a 1994 survey of lab managers, where just 13% of projects used publicly funded science, one of the lowest shares of any industry surveyed (and as compared to a 20% average).
So although pull policies seem to have worked really well, as a general rule, innovation in auto tech has largely been of the incremental type where pull policies usually work well (at least, according to evidence from health). But there may be one important exception: electric vehicles.
The transition to an all electric vehicle fleet is a a more radical kind of innovation than the kind of incremental changes discussed above. Aghion et al. (2016) and Rozendaal and Vollebergh (2021) are the only papers that address the impact of pull policies on electric vehicles. Both papers include electric vehicle patents among their measures of clean technology, though only Rozendaal and Vollebergh actually split out electric vehicle patents from the rest to see how emissions policies affect them specifically. But when they do, they find the effect of emissions standards on electric vehicles is actually stronger than it is for other technologies. A 10% increase in standards stringency is associated with 3% more electric vehicle patents, compared to an average of 2% across all clean technologies.
One possible answer to this question is that by the time of Rozendaal and Vollebergh’s study, electric vehicle technology was, in fact, commercially viable and so pull policies worked well. Electric vehicles have been around a long time, but what made the technology much more promising in the 21st century (when their study is set) seems to have been the development of a new class of powerful lightweight batteries (lithium ion batteries). The development of these batteries, meanwhile, seems to have been largely a case of a classic knowledge spillover from the consumer electronics sector. As far as I can determine, it wasn’t the case that these batteries were developed by carmakers spurred on by the promise of profits for developing radically more fuel efficient vehicles. They just got lucky; though luck like this happens all the time in innovation, and is why you should generally push forward innovation along lots of dimensions at once.
But in terms of the efficacy of pull policies, I worry that Rozendaal and Vollebergh’s finding that emissions standards worked very well to promote more radical electric vehicle innovation is another example of high standards being set when policymakers believe the technology is already capable of meeting them. Good luck brought the auto sector good batteries, and then after Tesla motors proved you could make desirable cars on the platform, policymakers decided to push the sector to adopt this new technology. But if the sector had not had the luck to get gifted better batteries from consumer electronics, or put another way, if these pull policies had been implemented before these batteries had been developed, maybe we would not see such good results.
But it’s tough to say. I think we have unusually good evidence here that pull policies certainly work for pushing forward incremental innovation. I’m skeptical that they work nearly so well for pushing forward radical technology, but the evidence we have isn’t so great on that question.
Thanks for reading! For other related articles by me, follow the links listed at the bottom of the article’s page on New Things Under the Sun (.com). And to keep up with what’s new on the site, of course subscribe!
Here’s two articles that provide some evidence for this claim, both based on the citations made by patents: Ripples in the River of Knowledge and Upstream Patenting Predicts Downstream Patenting
If you want to learn more about these kinds of policies, you might like these articles: More science leads to more innovation and An example of high returns to publicly funded R&D






Share this post