


New Things Under the Sun is a living literature review; when the literature changes, so do we! This post covers a few updates to articles. As a reminder, the most up-to-date versions of each article live on NewThingsUnderTheSun.com.
Announcements
Before getting into some updates, I wanted to flag a few opportunities that might be of interest to readers. Skip to the next section if you just want to read updates to New Things Under the Sun.
For UK-based academic researchers of science/innovation and those who might want to collaborate with them: UK Metascience and Open Philanthropy are jointly supporting a research funding opportunity of up to £5mn. From the funding call:
Aim: This funding opportunity aims to accelerate the generation of evidence on more effective ways of conducting and supporting R&D. All projects should have the potential to inform science policy, R&D funding practices, or practice within research-performing organisations.
International collaborations are welcome and co-leads of the projects can be from UK-based business, third sector, or government bodies. Proposals are due July 16 - see the funding call for details.
For aspirating writers excited about progress studies: The Roots of Progress is now accepting applications for their fellowship program, the 2024 Blog-Building Intensive. Learn about progress studies, get into a regular writing habit, improve your writing, and build your audience. The part-time program runs online from mid-August to mid-October, and ends with an in-person gathering in San Francisco. Apply before June 7th (and note last year’s program filled up quickly). More details here.
For academics interested in synthesizing and communicating research for non-specialists (like this newsletter): If you want to write about innovation, want to collaborate on a post? See here for details. Want to write on your own? Or maybe you already do? Email me to see whether Open Philanthropy can offer financial support for your project through our living literature review program.
For economists and economist wannabes who love science fiction: For the last three years I have helped organize an online economics science fiction reading club. This summer’s online zoom discussion will be June 28 at 3pm ET. If you’re interested, vote for the book and sign up for the mailing list here.
On to some new (or at least, new to me) research!
Disruption Debate
The post Science is getting harder surveyed a range of different lines of evidence that collectively (in my view) suggest the same amount of scientific effort is yielding smaller discoveries, in some sense. One of those lines of evidence was related to the consolidation-disruption index, and there has been a lot of debate about the interpretation of this index over time (see here, for example). It’s a big topic, and I’ve tried to focus my update on the parts I consider to be the crux, though others may disagree.
…The preceding suggested a decline in the number of new topics under study by looking at the words associated with papers. We can try to infer whether a similar process is underway using the Consolidation-Disruption Index (CD index for short), which attempts to score papers on the extent to which they overturn received ideas and birth new fields of inquiry. Here though, the evidence is ambiguous at best.
To see the basic idea of the CD index, suppose we want to see how disruptive is some particular paper x. To compute paper x’s CD index, we would identify all the papers that cite paper x or the papers x cites itself. We would then look to see if the papers that cite x also tend to cite x’s citations, or if they cite x alone. If every paper citing paper x also cites x’s own references, paper x has the minimum CD index score of -1. If some papers cite x and no papers cite any of paper x’s references, paper x has the maximum CD index score of +1. The intuition here is that if paper x overturned old ideas and made them obsolete, then we shouldn’t see people continuing to cite older work, at least in the same narrow research area. But if paper x is a mere incremental development, then future papers continue to cite older work alongside it.
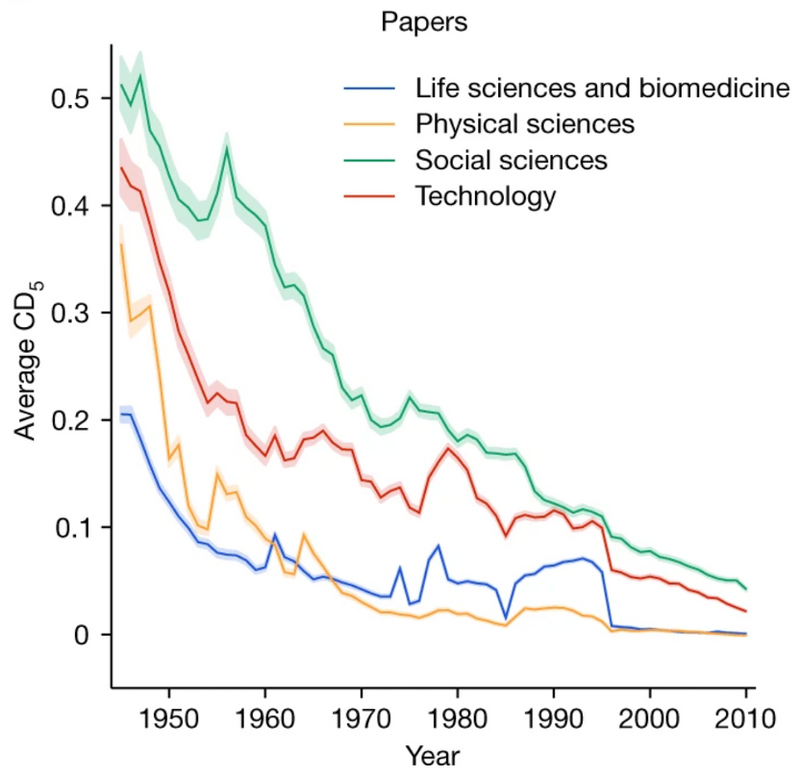
Park, Leahey, and Funk (2023) compute the CD index for a variety of different datasets of academic publications, encompassing many millions of papers. In the figure below, we have a representative result from 25 million papers drawn from the web of science. Across all major fields, the CD index has fallen substantially. That suggests, on average, papers are becoming more and more incremental, and less and less disruptive.
The trouble is, very similar results are also generated if there is no underlying change in the disruption of papers, but older papers begin to be cited at a higher rate and if the number of citations per paper increases. Both are true. We have already looked at the rising tendency to cite older literature at a higher rate, which might be evidence for science getting harder, but might also be driven by more innocuous factors. But it’s also true that the number of citations per paper has been rising. For example, according to Petersen, Arroyave, and Pammolli (2023) the average length of the reference list of a paper published in Science has increased from 7 in 1970 to 51 by 2020, despite a relatively consistent paper length (well, excluding appendices). Brendel and Schweitzer (2019) show references in a set of math journals rose from 5 per paper in 1950 to more than 25 per paper after 2010. Schweitzer and Brendel (2021) show the average number of references made in articles on an economics paper database grew from around 15 to over 40 between 1970 and 2014.
What’s generating this increase? There are lots of suspects. Maybe it’s the increase in peer reviewers, who suggest or demand additional citations. Maybe it’s the falling cost of finding relevant papers thanks to Google Scholar and other digital search technology. Or maybe it’s because more papers are incremental tweaks on the same core topics, so there is a greater supply of relevant work to cite.
Whatever the case, if citations per paper rises, that will tend to generate falling disruption scores. To see why, let’s imagine a paper is published in 1950 with zero references. Because it has no references, by definition, no papers that cite it can cite any of its references, and it will score the maximum disruption score of +1. Now imagine an equally disruptive paper published in 2020. Between peer reviewers and Google scholar, suppose this paper identifies 10 relevant citations. If anyone cites any of these 10 citations, then the 2020 version of the paper will get a lower disruption score than the 1950 version (even though the 1950 paper would have made similar citations if it could find them). And this problem isn’t unique to papers that make no citations; in general, as it gets easier to identify relevant work to cite, the disruption index for all papers will tend to fall as more papers cite your references and your list of references grows.
One way to assess the severity of this issue is to create placebo citation networks by randomly shuffling the actual citations papers make to other papers. So instead of paper y citing paper x, redirect the citation so that paper y now cites some other paper z, where z is published in the same year as x. This kind of reshuffling preserves the tendency over time of papers to cite more references and to increasingly cite older papers. But since the citations are now random, they should not convey any additional information about disruption. These placebo networks will exhibit a decline in disruption, for the reasons described above, but we can see if the actual decline in disruption exceeds this or not.
Park, Leahey, and Funk (2023) and Holst et al. (2024) both do this exercise, though on different datasets. In the figure at left below, we can see the results from Holst et al. (2024); using a different dataset from Park, Leahey, and Funk, they replicate the decline in the average disruption of papers over time (solid brown line). However, they show their randomly rewired placebo citation networks exhibit essentially the same trend (dashed line). That suggests any citation network exhibiting the same general patterns of growth in citations and the same tendency to cite older work would generate a decline in disruption that is on par with what’s observed in the data. In fact, they point out that the decline in the actual disruption index is a bit less than the decline in the placebo (note the gap between the lines shrinks).
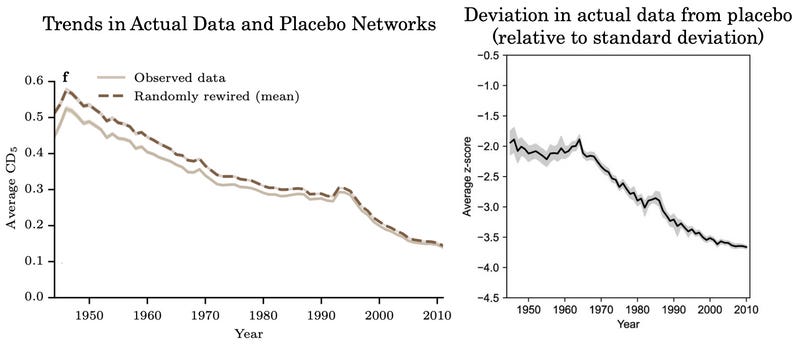
On the other hand, Park, Leahey, and Funk (2023) also perform this exercise and quantify the gap between the actual data and the placebo networks in a different way (see the figure above and to the right - Holst et al. 2024 produce a very similar figure). What this figure shows is the difference between the actual data and the average of placebo networks, using a particular kind of measurement called a z-score. In this case, the z-score measures the difference in the true CD index and the CD index of the same paper, if we randomly reshuffle the citation network. Unlike the figure at left, it indicates the gap between the true CD index and the one generated by random citation networks is growing.
How do we square these contrary results? It has to do with how each side measures the significance of a given gap. The graph at left holds constant its unit of measure. By using z-scores, the one on the right allows its unit of measure to change when the CD index of a given paper varies by more across different random networks. The idea is kind of analogous to how winning an individual poker hand is less impressive than winning a whole poker game, which is less impressive than consistently winning across a poker career. In this case, it appears to be the case that the variation in disruption scores among randomly generated citation networks has fallen substantially over time, likely for the reasons we’ve discussed. I interpret the figure on the right as asserting that smaller gaps between the true disruption score and the average disruption score of placebo networks should count for “more” as time goes on, because as time goes on, the rise in citations means it is harder for any particular paper to achieve an anomalously low disruption score. If we take that into account, papers seem to be getting less disruptive over time, relative to what we would expect; if not, the reverse is true. Like I said at the outset of this section: ambiguous.
(I think it’s also worth pointing out that this entire simulation approach takes it for granted that papers will increasingly cite older work, and looks for a decline in disruption above and beyond what we would expect purely from that fact.)
There was one more change to this post as well. Another section looks at linguistic changes to the text of academic articles to argue for a slowdown in the exploration of new topics. I added a paragraph pointing to Bentley et al. (2023), which points out similar linguistic patterns are displayed in non-scientific text as well, suggesting other forces might account for them.
Libraries and Innovation - Italian Monastery Edition
The post Free Knowledge and Innovation looks at the impact of free knowledge resources (Carnegie libraries, patent libraries, and wikipedia) on innovation. I’ve added to this post a discussion of Buonanno et al. (2024), which looks at the impact of increasing library collections on innovation in Italy in the 1800s.
Let's start in the 1800s. For the centuries leading up to then, European monastery libraries had been a repository of human knowledge - not just about theology and religion, but also mathematics, agriculture, and science in general. In the 1860s, Italy passed a series of laws that dissolved religious institutions and one consequence was the redistribution of monastic library books to public libraries (or in some cases, the founding of new libraries). That made the knowledge in those books more accessible.
Buonanno et al. (2024) study the long-run fallout of these knowledge injections into Italian public libraries. The first thing they establish is that the closure of monasteries had a large impact on the size of public library collections. For a set of libraries where they have information on the size of collections, those that received an injection from monasteries saw the average size of their collections rise from 29,751 volumes to 56,075 volumes (+88%). Among libraries that did not get an injection from monasteries, the size of their libraries only grew from 27,797 to 31,845 (+15%) over the same time period.
They then compare municipalities whose libraries received monastic books to municipalities that did not. Patenting went up significantly in the municipalities whose libraries got new books, compared to the ones who did not, after the redistribution. In the figure below, we see trends overall, and trends for urban municipalities only (more patenting was happening in urban municipalities). For the urban sample, municipalities that got more books saw about a 45% increase in patenting per capita, as compared to urban municipalities that didn’t receive books.

But a lot of other stuff was going on at the same time (patenting also went up in urban municipalities that didn’t receive more books, just not as much), so we have to be a bit cautious in attributing the effect purely to access to the knowledge contained in books. But Buonanno and coauthors do a lot of things to try and rule out alternative explanations. For example, instead of comparing across all municipalities, in one analysis they match each municipality that got more books to another that also had a library (but did not get more books), also had a monastery, had a similar population size, and that looked similar on various education related measures. But this analysis, which tries to compare like to like, gives them similar results. They also do a bunch of things to try and test out other potential links between the closure of monasteries and patenting: is it about land redistribution? Or maybe the dispersal of monks and nuns into the community? But neither of these seems correlated with changes in patenting. Finally, as a kind of placebo test, they look to see if giving more books to religious libraries affects patenting. Since religious books do not presumably contain much that is useful for inventing, we should not expect these kinds of injections to matter much - and they don’t.
Teacher Influence, Again
Back in December, I published a post about the influence of innovative mentors on their proteges. I’ve since found two articles that nicely complement that post: Gofman and Jin (2024) and Ma, Mukherjee, and Uzzi (2020). Adding discussion of them to the original post pushed its length well above my informal 4,000 word limit, and so I split the post in two shorter ones. One is titled Students Get Interested in What Their Mentors are Interested In, and the other is titled Teachers and the Transmission of Excellence. Here’s some discussion of those new papers, which is now part of the Teachers and the Transmission Post:
If productive researchers teach their students about more cutting edge research, then we should be able to see some indications of that in the subsequent activities of their students. For example, do the students of productive researchers tend to invent stuff that relies on cutting edge research? Do they found more innovative companies? Or we could flip it around: do students who lose access to productive researchers as teachers become less likely to found companies based on cutting edge research?
Gofman and Jin (2024) suggests they do. Gofman and Jin look at what happens to the probability alumni of a university found an AI-related startup, after AI faculty leave the university to work in the private sector. To do that, they gather information on AI startups from Crunchbase, including the university where the founder graduated from, and scour the LinkedIn profiles of AI professors to identify those who found startups or begin to work for industry. For any particular year, they show the alumni of a university are less likely to form AI startups if a greater share of its AI faculty left for industry in the preceding six years, and the startups that do form attract less investment.
Gofman and Jin provide a variety of evidence to suggest the reason for this startup shortfall is because students don’t learn as much about frontier AI research when faculty leave for industry. For example:
The departure of AI faculty only affects the propensity to start AI-related startups; it has no impact on the rate at which other kinds of IT-related startups are formed.
The effect is stronger for masters/PhD students, who are more likely to learn about frontier research, than for undergraduates.
The effect is stronger for faculty with expertise in deep learning (which is the dominant paradigm in AI at this time).
The effect is larger for tenured faculty, who Gofman and Jin argue are more likely to supervise students.
The effect of departure is stronger for faculty leaving 4-6 years before alumni graduate (which almost certainly impacted the ability to study with departing faculty) and weaker for those leaving 1-3 years before graduation (which leaves some time to study with them).
That’s all consistent with the notion that students actually do learn valuable stuff about frontier technology from their teachers who are studying frontier technology! On the other hand, as we worried at the outset of this post, perhaps this is an issue where good students who want to learn about frontier research become less likely to enroll in departments that lose AI faculty. If a department that loses AI faculty loses talented students, and those students are more likely to found startups that would account for the same finding, even if the teachers themselves didn’t influence their students. But Gofman and Jin show there is no impact of AI faculty departures on the number of graduate students who win prestigious fellowships, which they interpret as a rough proxy for the research potential of enrolled students.
Later, after a discussion of a paper that found adverse impacts on the professional success of PhD students who lost access to their math faculty, the paper turns to a discussion of Ma, Mukherjee, and Uzzi (2020).
Ma, Mukherjee, and Uzzi (2020) identify 37,157 mentors and proteges in biomedicine, chemistry, math, and physics, from between 1960 and 2017 using a database on dissertation theses (and some other sources). Some of these mentors went on to win prestigious awards for their research - others did not. If we think prizes accurately identify research excellence, we can then see if research excellence can be transmitted.
To handle the problem that great students might be attracted to prize-winning teachers, Ma and coauthors focus on mentorship occurring before the mentor won a prize for their research. For each prize-winning mentor, they try to identify “matched” mentors in the same discipline who were similarly successful at this stage in their career (i.e., before winning the prize), based on things like their publication record, the ranking of their university, and so on. As some evidence that future prize-winners attracted similar grad students as their matched peers at this point in their career, Ma and coauthors show the proteges fared similarly well early in their careers. They get jobs at similarly ranked universities, have similarly sized labs, and even score similarly on IQ tests. But, even if the broader profession could not detect it, Ma and coauthors argue that mentors who go on to be recognized for their research could still train their proteges to be excellent researchers.
And that seems to be the case. As indicated in the figure below, the students who studied under mentors who would eventually be recognized for their research tended to have significantly higher research impact themselves. They were more likely to win prizes of their own, be elected to the National Academy of Science, have higher H-indices, and be “superstars” in their discipline (which Ma and coauthors define as someone who wins prizes, belongs to the National Academy of Science, and is in the top quartile for citations). Note this holds even for proteges who graduated ten years or more before their mentor won a prize for their research (the dotted yellow bar at right).

The science to drug time gap
The post How Long Does It Take to Go From Science to Technology? looks at some papers that help estimate how long is the typical gap between scientific research and the impact of technologies that build on that science, arguing a twenty-year gap seems common. I’ve now added to that post an older paper that I missed at the time.
Let’s turn to one more industry study: pharmaceuticals. Toole (2012) wants to assess the link between NIH funded research and the invention of new drugs (rather than productivity growth). He has data on NIH funding for biomedical research from 1955 through 1996, broken down into six broad therapeutic areas: endocrine/cancer, central nervous system, cardiovascular, anti-infective, gastro-intestinal/genito-urinary, and respiratory. He’s also got data on the annual number of FDA approved drugs in these six categories. His study focuses on new molecular entities, that is, approved drugs featuring a novel active ingredient. He’s also got information on private sector R&D in these six categories, as well as the potential market for different therapeutic treatments. Toole shows both of these affect drug development too, but we’ll be focusing on the impact of scientific research.
The basic idea is to see if, in a particular therapeutic area, the number of new molecular entities submitted for approval to the FDA increase in the years after an increase in R&D spending by the NIH in the same category, and if so, how long is the gap between the two. To pin down the right lag, for each therapeutic area, Toole creates four different “knowledge stocks.” Each of these is basically the sum of past research spending, but giving more weight to more recent spending. One of these stocks includes all research funded more than 24 years ago. Another includes all research funded more than 16 years ago. Another focuses on research funded more than 8 years ago, and one more includes all prior research spending. When he includes all four in a statistical regression, the only one significantly correlated with new drug approvals is the one built from NIH research funded more than 16 years ago. In other words, the best predictor of new molecular entity approval applications in a given therapeutic area is the funding conducted roughly 17-24 years previously.
Thanks for reading! As always, if you want to chat about this post or innovation in generally, let’s grab a virtual coffee. Send me an email and we’ll put something in the calendar.