New Things Under the Sun is a living literature review; when the literature changes, so do we! This post covers a few updates to articles. As a reminder, the most up-to-date versions of each article live on NewThingsUnderTheSun.com.
But before we get into that, some announcements.
Most importantly, my job is (temporarily) changing in ways that affect New Things Under the Sun. Open Philanthropy (my employer) has launched a new Abundance and Growth Fund, which will spend $120mn over the next three years to accelerate economic growth and boost scientific and technological progress while lowering the cost of living. I’ll be the interim lead of this program while we conduct a hiring round.
During that time, I will probably write a bit less, and less of what I do write will be for New Things Under the Sun. Instead, I plan to write more about specific ways to accelerate economic growth and boost scientific/technological progress, drawing more on the internal research I and others do at Open Philanthropy. I think this state of affairs will last a few months, and then I’ll reassess.
The International Conference on the Science of Science is accepting submissions for the 2025 conference this summer from now until March 21. More here.
The Experiment Foundation is seeking researchers to collaborate on evaluating its Science Angel program. Applications due March 28. More here.
As noted above, Open Philanthropy is launching the Abundance and Growth Fund, and seeking a Senior Program Officer to lead its strategy and grantmaking. Refer a strong candidate and get a $5k reward if Open Phil hires them. Learn more and apply here by March 31st.
Study the impact of AI on the science and research ecosystem with an AI early career fellowship! There are a few funding organizations, including UKRI, the Alfred P. Sloan Foundation, and the Social Sciences and Humanities Research Council (SSHRC) of Canada. Applications due April 10. More details here.
The Metascience Alliance, a new cross-sector network fostering collaboration to better understand and improve the research system, is looking for your feedback! Read more here.
Now for some updates to the living literature review!
Starbucks and Innovation
The post Urban social infrastructure and innovation looks at some evidence that cities serve as a place where the intermixing of people and their ideas facilitates innovation. I’ve added to this post two recent papers that look at the influence of Starbucks(!) on innovation. The updated post picks up after discussing a paper on the impact of bars on innovation during the prohibition era.
Today, it’s not so obvious that bars would serve the same third place function as they did in prohibition. Instead, coffee shops might fill that role.
Starbucks provides a particularly useful case study of modern third places. At the time it was founded, coffee shops as a place to spend time and meet other people were not very common, and Starbucks saw part of its value proposition to customers to be providing this. The company's expansion from Seattle provides a natural experiment: the first Starbucks opened in Seattle in 1971, but it wasn't until 1993 that the company opened its first East Coast location in Washington DC.
Two recent papers leverage this rollout of Starbucks locations to assess how this kind of social infrastructure affects innovation. Andrews and Lensing (2024) look at the effect of getting a local Starbucks on patents, while Choi, Guzman, and Small (2024) examine impacts on the rates of entrepreneurship. Both papers want to compare metrics of innovation in localities that have more Starbucks to localities with fewer, but face the same issue: Starbucks doesn't randomly choose where to open new stores. The company probably tries to open stores in neighborhoods that are either doing well, or are forecast to be doing well - exactly the kind of places that might have gotten more innovative anyway, even without a Starbucks.
Each paper tackles this challenge differently. Andrews and Lensing exploit the fact that Starbucks expanded geographically outward from Seattle. The basic idea is that the further you are from Seattle, the fewer Starbucks you are likely to have, but this effect diminishes over time. In some analyses, they use distance from Seattle to predict how many Starbucks a place would be expected to have in a given year, and then use those predictions to assess the impact of Starbucks on patenting. The key assumption is there aren't other factors that affected patenting and spread out concentrically from Seattle over a few decades; just Starbucks. As a bit of evidence that this theory is correct, they show in one analysis that if you try to predict patenting using distance from Seattle (and time) in the twenty years *before* Starbucks was founded, there's no obvious pattern; you only see distance from Seattle over time mattering during the era of the Starbucks rollout.
Meanwhile, Choi and coauthors take a different approach, and compare census tracts that got a Starbucks to similar ones that didn't. In some cases, they specifically compare tracts that got a Starbucks to ones that were supposed to get one, but where the deal fell through for idiosyncratic reasons (like zoning board rejections). The idea here is that these pairs of census tracts were similarly attractive to Starbucks, but only some actually got one.
Under their preferred statistical models, both papers find substantial effects. Andrews and Lensing find that when the growth rate of new Starbucks establishments in a county increases by 10%, patenting in that county increases by 3-4%. Choi and coauthors find getting a first Starbucks in your census tract leads to 5-15% more startups in that tract over the next seven years.
Those are big effects - do we really believe they're the result of complicated (for the time) coffee orders? Both papers present additional evidence to try and shore up our confidence. For example, Choi and coauthors find particularly large effects - nearly 30% more startups - in an analysis of locations opened through a partnership between Starbucks and Magic Johnson. This partnership specifically targeted low-income minority neighborhoods that Starbucks probably would not normally have entered. That suggests the benefits of getting a Starbucks aren't merely about the company's ability to forecast which neighborhoods are about to take off.
There's also evidence that these effects really are driven by people meeting and sharing ideas at Starbucks. Andrews and Lensing find patents are more likely to cite other patents from the same state after Starbucks arrives, consistent with more local exchange of ideas. Choi and coauthors find you get similar effects for other chains that try to be third places, such as Caribou Coffee, but not for chains like Dunkin' Donuts that serve coffee but aren't set up for extended seating. They also find no effect from small Starbucks locations (like the ones inside Target stores) that don't facilitate interaction.
Lastly, another reason for the big effect might be that it's not all about connections made at Starbucks. Andrews and Lensing find that when Starbucks enters a market, it tends to predict additional coffee shops opening up too. So it might be that the increase in interactions happens at coffee shops in general, and that Starbucks is just a catalyst to jumpstarting a coffee scene. That's consistent with another result from Choi and coauthors: there is no impact on entrepreneurship when Starbucks enters a census tract that already had a coffee shop.
A New Way to Measure Unusual Combinations of Research Ideas
The post The best new ideas combine disparate old ideas looks at a bunch of evidence that papers which forge unexpected connections between different ideas tend to be higher impact, as measured in different ways. In this literature, it’s always a challenge to find ways to measure the “ideas” that papers are combining. A variety of approaches have been used over time. In this update, I add discussion of a new one.
… Yu and Romero (2024) … look at the datasets used by papers. The data used in a paper represents another concrete way to track what ideas and evidence it draws upon.
Yu and Romero study over 30,000 papers that use datasets from the Interuniversity Consortium for Political and Social Research (ICPSR), a major repository of social science data. Most papers (71%) use just one dataset, but those that do combine datasets in unusual ways tend to receive more citations. For each standard deviation increase in how atypical a paper's combination of datasets is, papers receive 18.4% more citations over three years. The effect is similar over five and ten year windows. These papers are also more likely to be discussed outside of academia: papers with more atypical combinations of datasets are significantly more likely to be mentioned on Wikipedia and Twitter.
The post Twitter and the spread of academic knowledge looks at a variety of studies that try to assess whether tweeting about papers raises awareness of research by other academics. One claim I made in that post was that if tweeting about a paper boosts citations on the order of 10%, which several studies suggest might be the case, then existing studies were too small to detect that effect with high confidence. A new paper supports that claim.
Sofer (2024) offers the largest study to date on this question, examining nearly 3,000 National Bureau of Economic Research (NBER) working papers published between 2015 and 2018. The NBER working paper series is a prestigious platform where economists share research before formal peer-reviewed publication. Usefully for Sofer, all NBER working papers receive a tweet from the NBER communications office, regardless of author preferences.
Similar to Chan et al. (2023) [discussed more in the main post], Sofer exploits the quasi-random timing of tweets to identify variation in tweeting that isn’t related to paper quality. Rather than just looking at day of the week effects [as Chan did], Sofer develops two instrumental variables: a "Twitter Attention Index" that measures economists' activity levels on Twitter at different hours of the day and days of the week, and a "News Pressure Index" based on the Wall Street Journal's front page "What's News" section, which indicates when major economic news events might be diverting attention from academic content. He shows that when the NBER tweets about a paper during hours when economists are highly active on Twitter (typically weekday mornings around 9 AM), that paper receives significantly more engagement. Conversely, when a paper is tweeted on days with major economic news events, it receives less attention. Sofer uses the timing of tweets to predict twitter activity, with no reference to a paper’s underlying quality, and then looks to see if these predicted tweets are correlated with subsequent citations.
Sofer finds different effects across different time horizons. In the first year after publication, increased Twitter visibility doesn't significantly affect academic citations. However, by the fourth year after publication, papers with higher Twitter visibility (as predicted by the time of day NBER tweeted about it) receive about 1.44 more citations – an effect that's (finally) statistically significant at the 5% level.
The post Science is getting harder looks at a number of different indicators that I interpret as indicating it’s getting more challenging to make scientific discoveries with the same impact as the past. One of these indicators is the consolidation-disruption (CD) index. There has been some debate about how this indicator has changed over time and how to interpret those changes, and I’ve updated the post to reflect the evolution of the debate.
Note however, that my target reader for New Things Under the Sun is a non-specialist interested in what the current state of the evidence says, not so much the history of how we got to our current understanding. Accordingly, I give the debate short-shrift in the update. However, if you want to see how I’ve covered this update here was the original coverage and here was a major update. I will update this post again as the research evolves.
To see the basic idea of the CD index, suppose we want to see how disruptive is some particular paper x. To compute paper x’s CD index, we would identify all the papers that cite paper x or the papers x cites itself. We would then look to see if the papers that cite x also tend to cite x’s citations, or if they cite x alone. If every paper citing paper x also cites x’s own references, then paper x has the minimum CD index score of -1. If some papers cite x and no papers cite any of paper x’s references, paper x has the maximum CD index score of +1. The intuition here is that if paper x overturned old ideas and made them obsolete, then we shouldn’t see people continuing to cite older work, at least in the same narrow research area. But if paper x is a mere incremental development, then future papers continue to cite older work alongside it.
Park, Leahey, and Funk (2023) compute the CD index for a variety of different datasets of academic publications, encompassing many millions of papers. They find the average disruption index for a paper has declined substantially since the 1940s. But we need to be cautious about interpreting a declining CD index score as evidence that the average paper has, in fact, become more incremental and less disruptive over time. This is because changing citation practices can also impact a paper’s disruption score. In particular, all else equal, it can be shown that disruption scores will tend to decline if papers make more citations, and if they cite older papers. Both have happened (see the second appendix for more discussion), so we need a way to try and separate out the decline in the disruption index that we can attribute to changing citation norms, and the share that we can attribute to a decline in actual disruption.
This paper generated a lot of debate, and in a 2025 response, Park, Leahey, and Funk perform an analysis that tries to separate out the influence of changing citation practices and disruption. The key idea is to generate 10 placebo citation networks, where citations are not informative about the extent to which a paper is disruptive, but which do exhibit changing citation practices. They can then see if the actual decline in disruption exceeds the decline observed in the placebo networks. To do that, they randomly shuffle the actual citations papers make to other papers. So instead of paper y citing paper x, they redirect the citation so that paper y now cites some other paper z, where z is some random paper published in the same year as x. This kind of reshuffling preserves the tendency over time of papers to cite more references and to increasingly cite older papers. But since the citations are now random, they should not convey any real information about actual disruption. These placebo networks will exhibit a decline in disruption, for the reasons noted above related to changing citation practices, but we can see if the actual decline in disruption exceeds this or not.
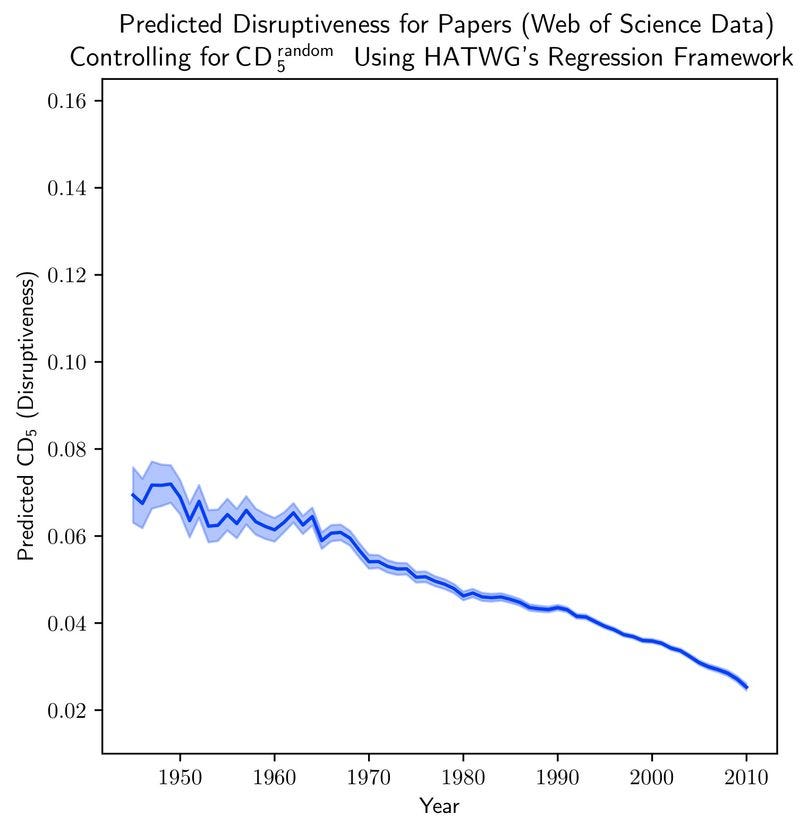
In the following figure, drawing on 25 million papers from the web of science, Park, Leahey, and Funk (2025) look at the average disruption of a paper over time, controlling for the disruption score of the same paper in the placebo networks. For example, a paper that cites a lot of papers, or a lot of older papers, might be more likely to have a low disruption score, purely as a consequence of this citation strategy. But that will be reflected in the disruption score of that paper in these placebo networks (which preserve the growing tendency to cite more and older papers). As indicated in the figure, actual papers still exhibit a decline in disruption relative to these placebos. While changing citation norms definitely contribute a lot to the decline in the disruption index, Park, Leahey, and Funk still see a decline when we try to control for those.
Figure S3 (left) from Park, Leahey, and Funk (2025)
(I think it’s also worth pointing out that this entire simulation approach takes it for granted that papers will increasingly cite more and older work, and looks for a decline in disruption above and beyond what we would expect purely from that fact. But as argued elsewhere, the shift towards citing older work is itself potentially evidence that something is changing in science.)
Thanks for reading! As always, if you want to chat about this post or innovation in generally, let’s grab a virtual coffee. Send me an email at matt@newthingsunderthesun.com and we’ll put something in the calendar.